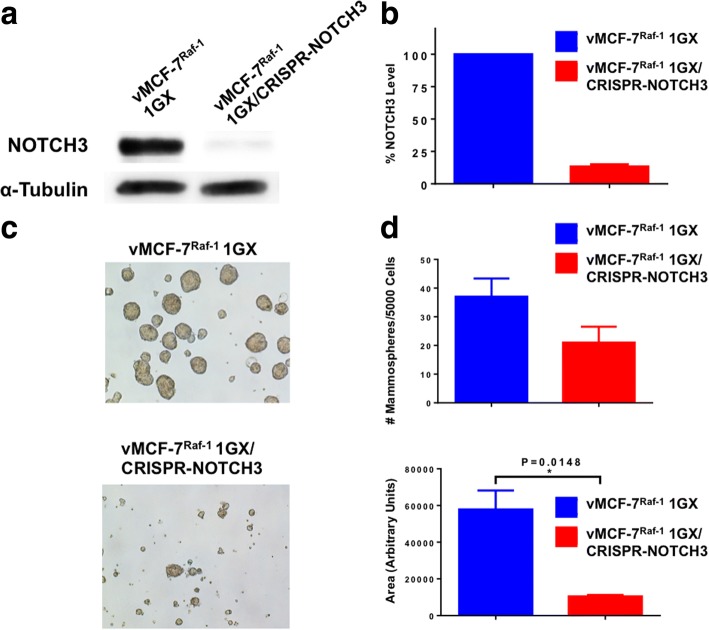
Fig. 4.
Molecular characterization of vMCF-7∆Raf1 1GX cells with abrogated NOTCH3 expression. a Immunoblot assay showing expression of NOTCH3 in vMCF-7∆Raf1 1GX and vMCF-7∆Raf1 1GX/CRISPR-NOTCH3 cancer cells. b Densitometric analysis showing the percentage of NOTCH3 protein level in vMCF-7∆Raf1 1GX/CRISPR-NOTCH3 cells relative to parental cells. Graph showing the average from three independent experiments (± SD). c Representative images of light microscopic analysis showing mammosphere (MPS) formation from vMCF-7∆Raf1 1GX and vMCF-7∆Raf1 1GX/CRISPR-NOTCH3 cells after 24 days of culture under nonadherent conditions (three serial passages). d Graphs showing the number and the size of MPS derived from vMCF-7∆Raf1 1GX and vMCF-7∆Raf1 1GX/CRISPR-NOTCH3 cells after 24 days of culture under nonadherent conditions (three serial passages). MPS size was quantified using National Institutes of Health ImageJ software (http://imagej.nih.gov/ij). Graphs show the average from three independent experiments (± SD)

