Fig. 7.
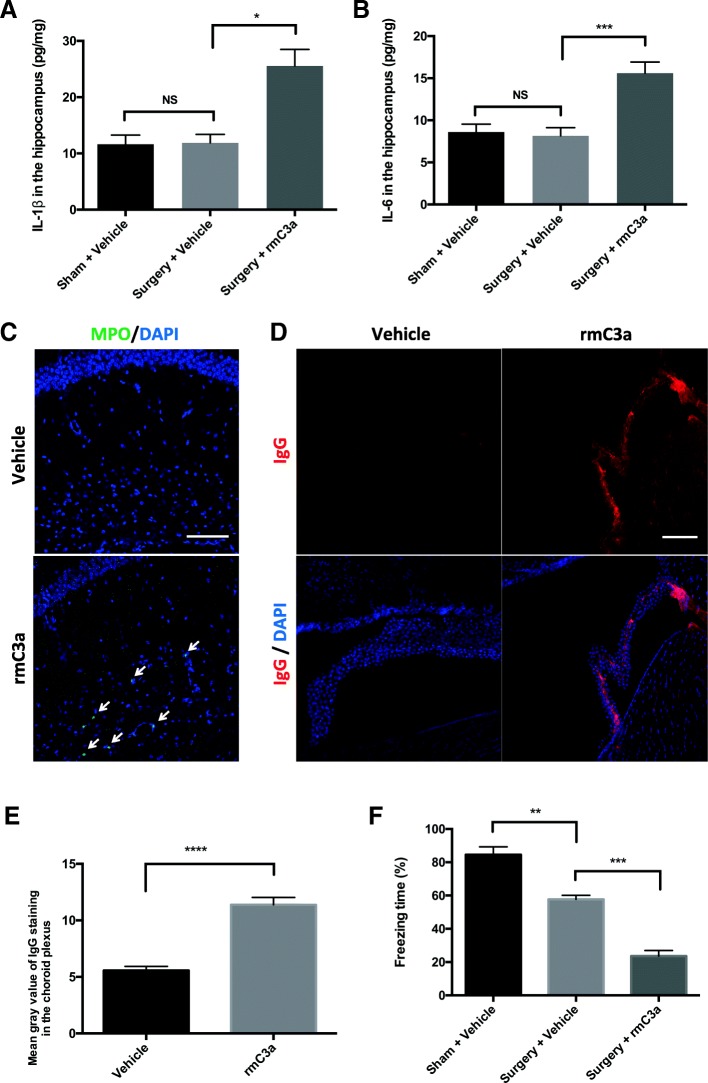
Pharmacological activation of C3aR exacerbated PND-like pathology. ELISA was used to quantify hippocampal IL-1β (a) and IL-6 (b) on postoperative day 3 in three groups: sham + vehicle, surgery + vehicle, and surgery + rmC3a (one-way analysis of variance followed by Student-Newman-Keuls test; n = 5). c Representative images of MPO staining in the hippocampus of vehicle- and rmC3a-treated mice; white arrows indicate MPO+ cells. d Representative images of IgG labeling in the choroid plexus of vehicle- and rmC3a-treated mice. Nuclear counterstaining with DAPI (blue) (c, d). e Quantification of IgG fluorescence intensity (unpaired Student’s t test; n = 5). f Quantification of the percentage of freezing time during the context on postoperative day 1 (one-way analysis of variance followed by Tukey post hoc test). Scale bar = 100 μm (a and c). *p < 0.05, **p < 0.01, ***p < 0.001, ****p < 0.0001

