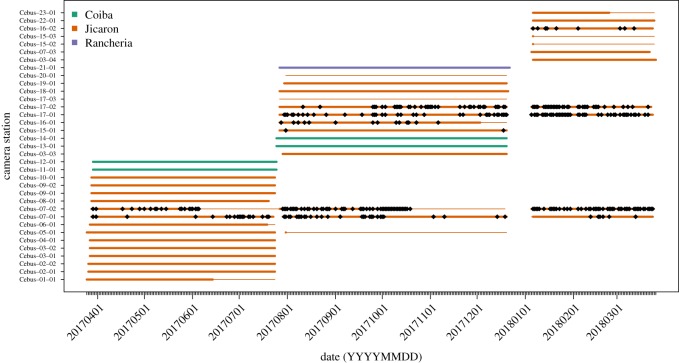
Figure 1.
Visualization of camera trap sampling effort. Rows are camera trap locations. Smaller lines indicate length of deployment, thick lines indicate period of deployment when camera was filming and focused on tool use site (i.e. was not moved by animals, had working batteries, was not stolen or vandalized). Diamond points occur at each day where stone tool use was recorded. Colours indicate island in Coiba National Park.

