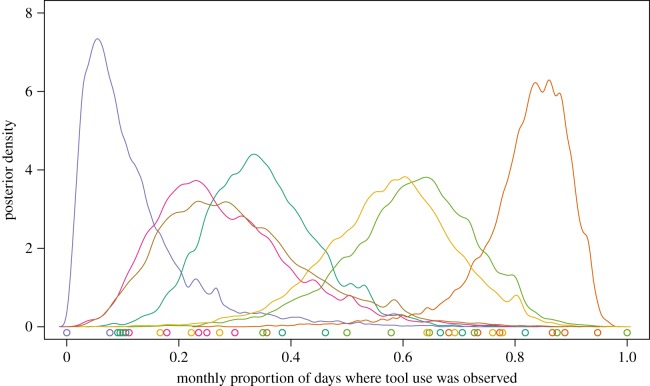
Figure 3.
Tool use sites differed greatly in their observed usage. On average, tool use was observed at each camera site on 45.3% of days where capuchins were observed. Cameras at the most active tool use sites (orange curve on far right) recorded tool use on 83.2% of the days where capuchins were observed. Curves show posterior predictions of probability of observing tool use on each day conditional on observing a capuchin across all months. Colours correspond to camera stations. Points on X-axis are raw proportions.

