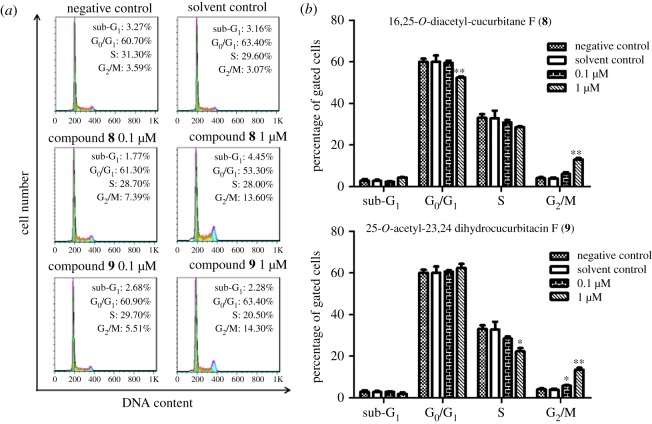
Figure 4.
Effect of 16,25-O-diacetyl-cucurbitane F (8) and 25-O-acetyl-23,24-dihydrocucurbitacin F (9) on cell cycle distribution. (a) Representative DNA histograms of cell cycle analysis in HT29 cells. The cells were treated with either 8 (0, 0.1 and 1.0 µM), 9 (0.1 and 1.0 µM) or DMSO (2‰) for 24 h, stained with PI and analysed by flow cytometry, respectively. (b) Graphical representation of the cell cycle phase distribution. The results show the mean ± s.e.m. of three independent experiments. Significantly different (*p < 0.05, **p < 0.01) compared with negative control (0 µM-treated).

