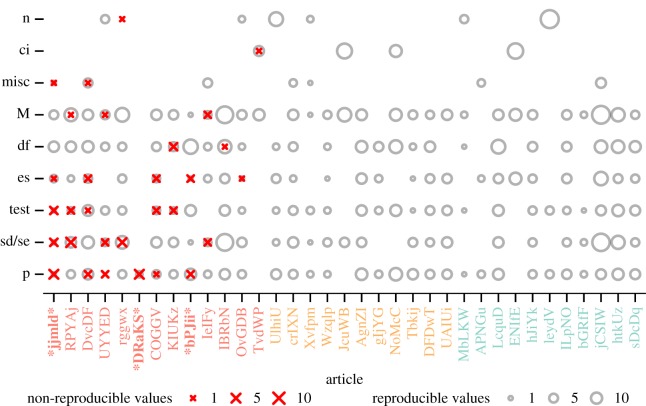
Figure 3.
All 1324 values were checked for reproducibility as a function of article and value type (n = count/proportion; ci = confidence interval; misc = miscellaneous; M = mean/median; df = degrees of freedom; es = effect size; test = test statistic; p = p-value; sd/se = standard deviation/standard error. Bold red X marks indicate non-reproducible values (major errors) and grey circles indicate reproducible values. Symbol size represents the number of values. Both axes are ordered by an increasing number of errors towards the graph origin. The article colours represent the overall outcome: not fully reproducible despite author assistance (red), reproducible with author assistance (orange) and reproducible without author assistance (green). For articles marked within asterisks (*), the analysis could not be completed and there was insufficient information to determine whether original conclusions were affected. In all other cases, it is unlikely that original conclusions were affected.

