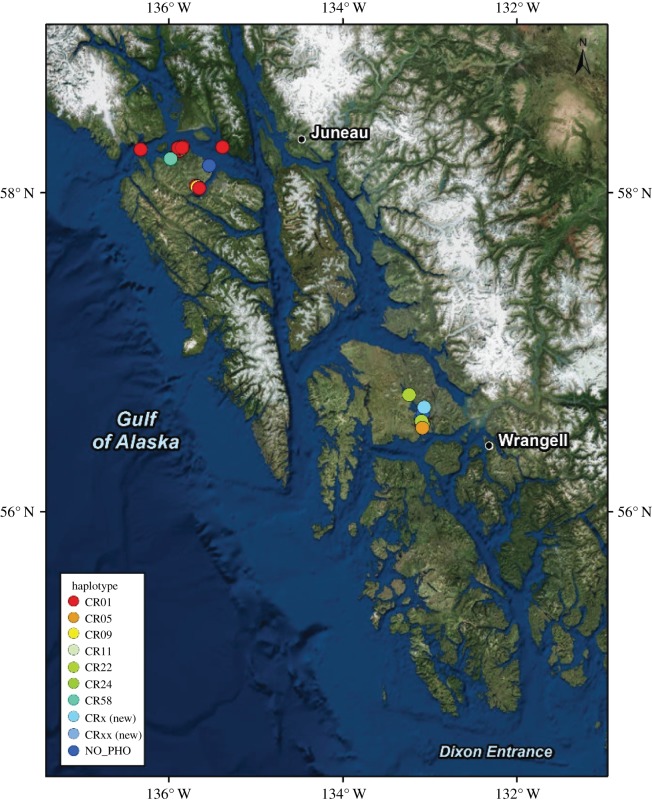
Figure 1.
Environmental DNA (eDNA) sampling locations in southeast Alaska. Colours indicate mitochondrial control region haplotypes resolved from 36 eDNA samples (basemap source: Esri, DigitalGlobe, GeoEye, Earthstar Geographics, CNES/Airbus DS, USDA, USGS, AeroGRID, IGN, and the GIS User Community).

