Figure 3.

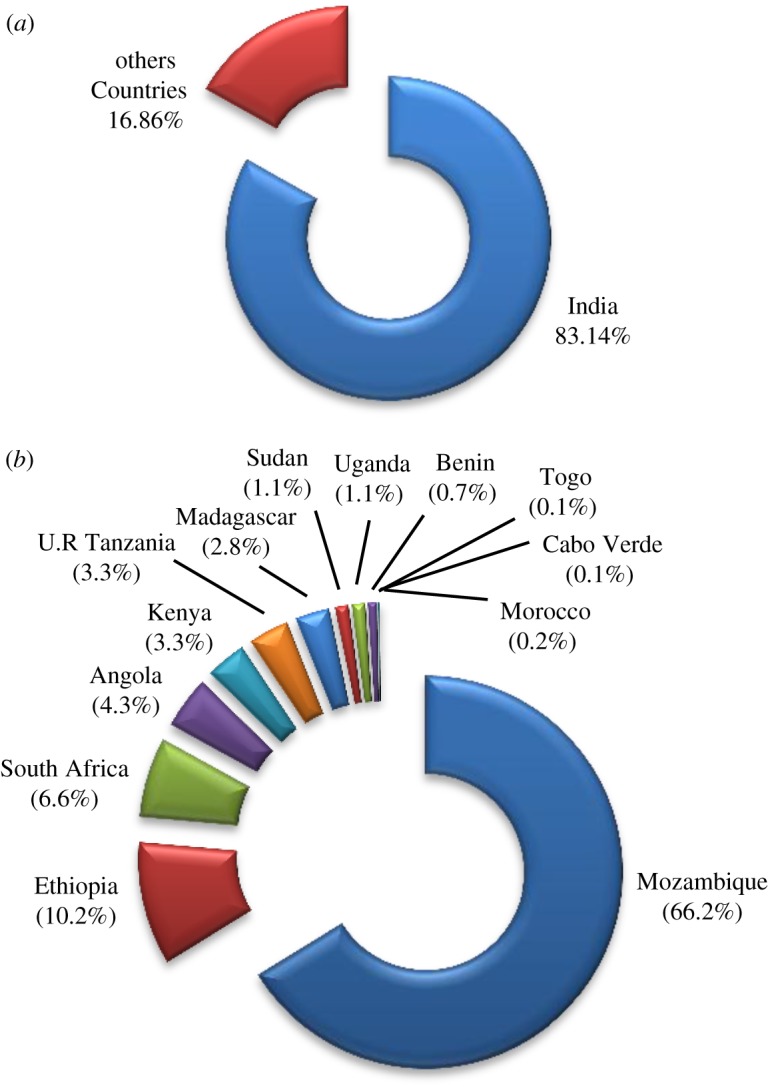
Charts showing production of CO seeds: (a) in the world and (b) in Africa, considering production figures from 2009 to 2013 obtained from FAOSTAT [46].

Charts showing production of CO seeds: (a) in the world and (b) in Africa, considering production figures from 2009 to 2013 obtained from FAOSTAT [46].