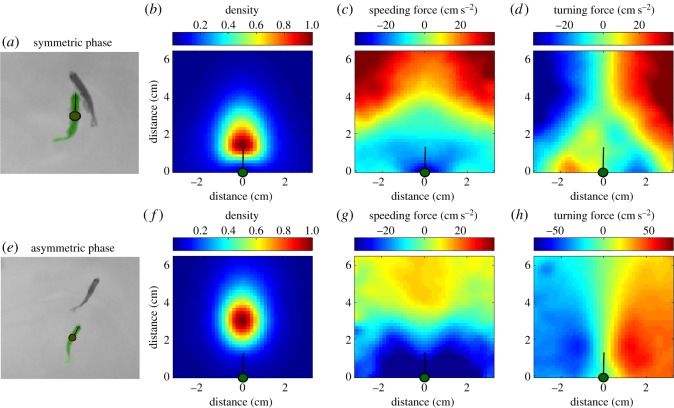
Figure 4.
Forcemaps of the attacker in the symmetric (a–d) and asymmetric (e–h) phase. (a) Typical configuration of the two fish during the symmetric phase. (b) Probability density map of the position of the defender relative to the attacker during the symmetric phase. (c) Speeding force of attacker as a function of the relative location of the defender during the symmetric phase. Red colour corresponds to speeding up and blue to slowing down. (d) Turning acceleration of the attacker as a function of the relative location of the defender during the symmetric phase. Red colours correspond to turning to the right and blue to the left. (e) Typical configuration of the two fish during the asymmetric phase. (f–h) Same as (b–d) for the asymmetric phase. All maps averaged over N = 14 fights, 230 000 time points.

