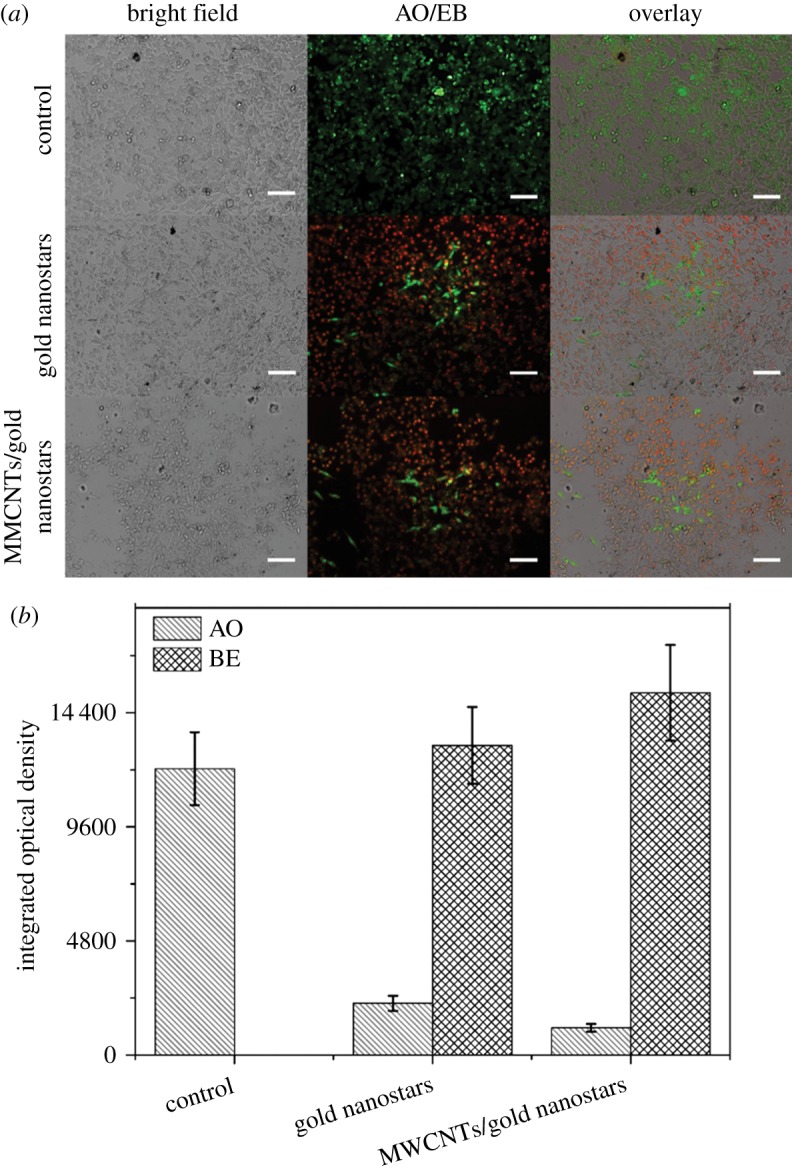
Figure 5.

(a) Fluorescence images of AO/EB-stained B16F10 cells incubated with a control condition, gold nanostars and MWCNTs/gold nanostars at the same concentration of 0.32 nM. Scale bars, 100 µm. (b) Fluorescence intensity of AO/EB. Data are presented as means ± standard errors (n = 5).
