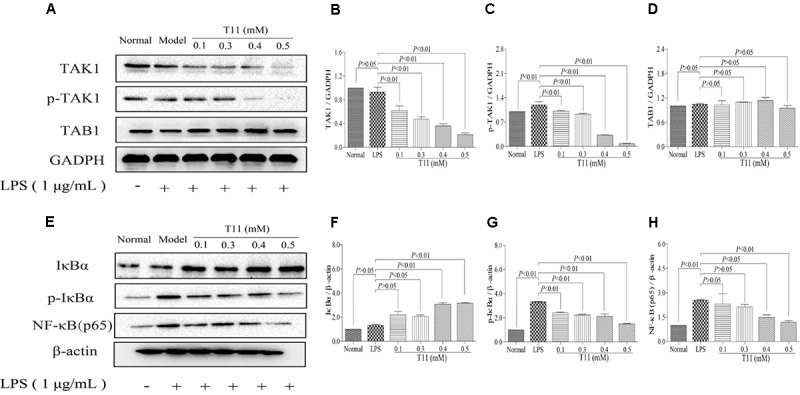
FIGURE 3.

T11 decreased the activation of NF-κB signaling pathway in LPS-stimulated RAW 264.7 cells. (A) The proteins levels of TAK1, p-TAK1 and TAB1 were detected by western blot. (B) TAK1 expression. (C) p-TAK1 expression. (D) TAB1 expression. (E) The proteins levels of IκBα, p-IκBα and NF-κB (p65) were detected by western blot. (F) IκBα expression. (G) p-IκBα expression. (H) NF-κB (p65) expression. The data reveal as the mean ± SEM (n = 3 in each group). Group comparisons were performed by one-way analysis of variance (ANOVA) followed by post hoc Tukey’s test or Student’s t-test when appropriate. P < 0.05 was considered as statistical significance.
