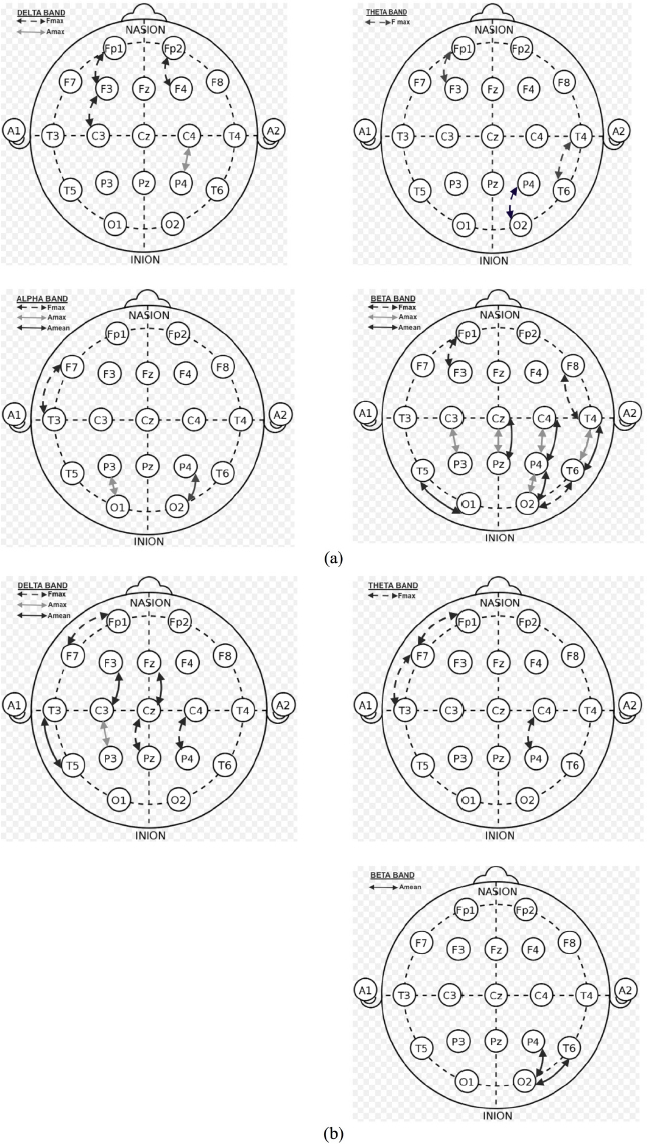
Figure 4.

Representation of the statistically significant active electrodes according to the maximum frequency, maximum amplitude, and mean amplitude of power values (a) for the Methylphenidate using ADHD/Control groups, and (b) for the Atomoxetine using ADHD/Control groups.
