
Figure 3.
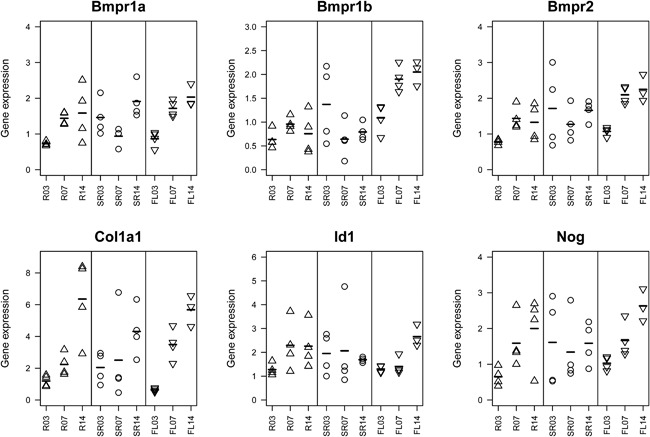
Expression analyses of candidate genes. Genes were selected from a previous in vitro study that identified mechano‐responsive cascades in the BMP signaling path.(25) Expression levels of n = 4 animals per group and per time point are displayed (R03 corresponds to rigid group at day 3; SR = semi‐rigid group; FL = flexible group; 07 = day 7; 14 = day 14). Although all animals were treated with the same amount of BMP2, we observed differential regulation of BMP receptor genes (top) and the BMP antagonist Noggin (bottom right). Col1a1 is upregulated over time in all treatment groups. However, in the later time points, we observed increasing variance within groups. Expression pattern of Id1 shows lower levels at day 3 upon rigid fixation and at days 3 and 7 upon flexible stabilization. For each gene, relative expression is shown. Symbols represent single animals, and bars indicate mean expression at the indicated time points.