Figure 2.

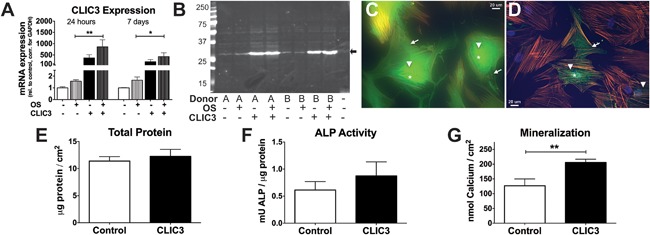
CLIC3 overexpression enhances human osteoblast differentiation. Enhancement of CLIC3 expression was assessed by (A) quantification of CLIC3 mRNA expression by quantitative PCR of hMSCs transduced with empty vector (white bars) or CLIC3 overexpression vector (black bars) under nondifferentiating (solid bars) or osteogenic differentiation (patterned bars) conditions at 24 hours (left 4 bars) or 7 days (right 4 bars) after the start of differentiation, or by (B) immunoblotting in protein lysates collected 10 days postinduction of differentiation in two hMSC donors (A and B) using anti‐CLIC3 antibody. Arrow indicates the predicted size of CLIC3 protein at 27 kDa, last lane contains loading buffer only. In additional CLIC3 expression was visualized by immunofluorescence microscopy using CLIC3 antibody in hMSCs differentiated to osteoblasts and transduced with CLIC3 (C) or empty vector (D) at total magnification of ×400 after 4 days of differentiation. CLIC3, in green, is seen in the cytoplasm (arrows), the perinuclear region (arrowheads), and some nuclear staining (asterisk); actin cytoskeleton was visualized by phalloidin antibody in orange, and nuclei by DAPI in blue. Biochemical assays are shown for total protein (day 6) (E), ALP activity (day 6) (F), and mineralization (week 3) (G) of hMSCs transduced with CLIC3 (black bars) or empty vector (white bars) and osteogenic culture conditions. Graphs display combined results of all experiments. (A) n = 8–12; (E,F) n = 18; (G) n = 19. *p < 0.05, **p < 0.01. OS = osteogenic media. CLIC3 = lentiviral transduction with CLIC3 expression vector 1 day prior to the start of differentiation; DAPI = 4,6‐diamidino‐2‐phenylindole.
