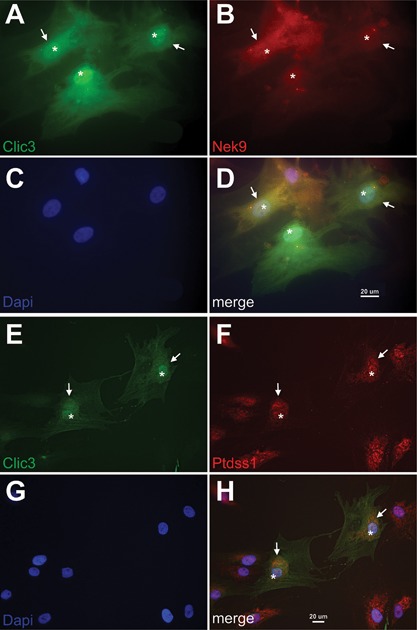
Figure 5.

CLIC3 colocalizes with PTDSS1 and NEK9 in differentiating osteoblasts. Using immunofluorescence microscopy, CLIC3 (A, D, green) and NEK9 (B, D, red) were visualized together in hMSCs differentiated toward osteoblast and overexpressing CLIC3 at magnification ×630. C, D show nuclear staining by DAPI in blue. Arrows indicate detection of both proteins in the perinuclear region and asterisks denote nuclear localization. Immunofluorescent detection of CLIC3 (E, H, green) and PTDSS1 (F, H, red) were visualized jointly in osteogenic hMSCs overexpressing CLIC3 at magnification ×400. G, H show nuclear staining by DAPI in blue. PTDSS1 and CLIC3 are both seen in the perinuclear (arrows) and nuclear (asterisks) compartments. DAPI = 4,6‐diamidino‐2‐phenylindole.
