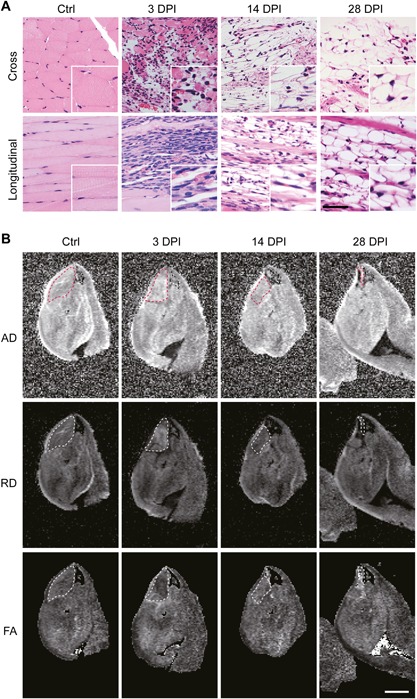
Figure 3.

Sections and scalar maps of the TA muscle of Adam10Pax7 mice after muscle injury. (A) Cross‐sections and longitudinal sections of the Ctrl hind limb and the hind limbs collected at 3, 14, and 28 DPI. The insets show a magnified image. Scale bar = 100 µm for the low magnification and 50 µm for the insets. (B) AD, RD, and FA maps of the TA muscle. The dotted lines delineate the TA muscle (ROI). Scale bar = 2 mm.
