Figure 2.
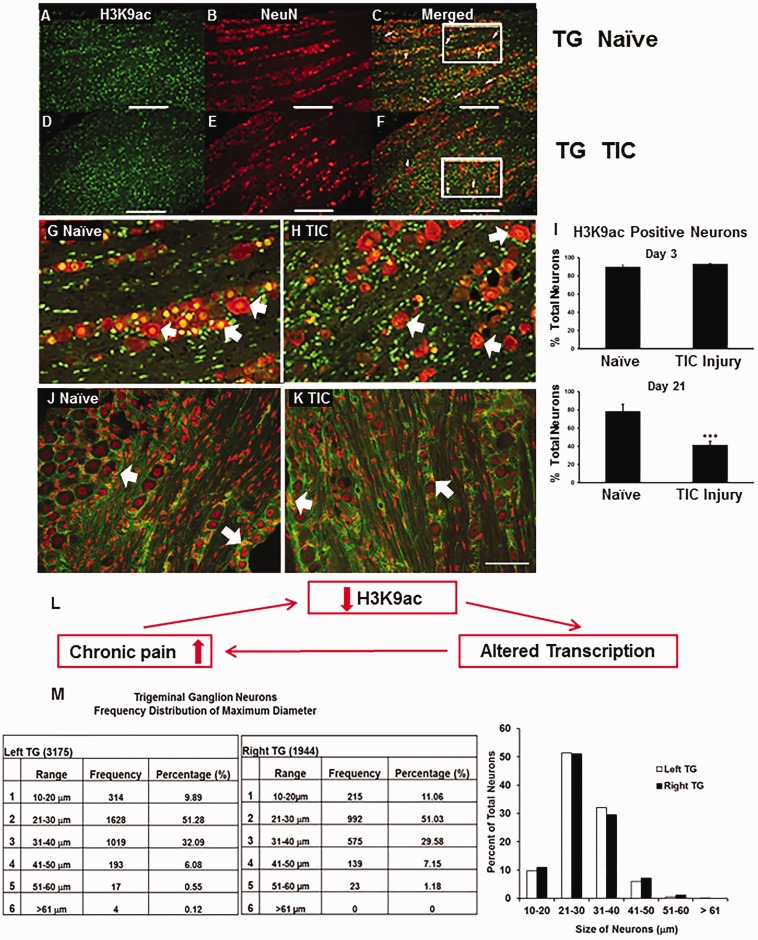
Trigeminal nerve injury leads to significant decrease in H3K9 acetylation of trigeminal ganglia (TG) neurons 21 days after injury compared to naïves. Expression of H3K9ac (a, green) and neuronal marker NeuN (b, red) in TG neurons of a naïve mouse is shown as a merged image in (c). Expression of H3K9ac (d) and NeuN (e) in TG of a mouse with TIC nerve injury at the 21-day time point is shown as a merged image in (f). Neurons double labeled with H3K9ac appear orange (white arrows). Enlarged images in (g) and (h) are from the framed areas in panels (c) and (f), respectively. The bar graph (i) shows the percentage of TG neurons expressing H3K9ac (n = 3 per group, 6890 neurons counted) (*** p ≤ 0.01, t-test). Scale bar = 200 μm. H3K9ac in non-neuronal TG cells. H3K9ac immunoreactivity was localized on the nuclei of neurons and non-neuronal structures (red). Satellite glial cells (and potentially epithelial cells and Schwann cells) were stained for glutamine synthetase in the TG (green). Example of dual labeling of H3K9ac (red) and non-neuronal marker glutamine synthetase (green) in TG from a naïve mouse (j) and a TIC injury mouse (k) at 21 days. Some of the satellite glial cells are indicated with white arrows. H3K9ac immunoreactivity visually appears more prevalent in TG from naïve mice than in the trigeminal nerve-injured mice. Bar = 100 µm. Nerve injury decreases H3K9ac, alters transcription, and can increase pain. The summary diagram (l) depicts the relationship of nerve injury pain to H3K9ac decrease, altered transcription, and resultant further increase in pain. Trigeminal ganglia neuronal counts and size distribution in mice. A total of 5119 TG neurons were counted and measured from three naïve mice (m). The data show the similarity in the size distribution for the left and right TG in the male BALB/C mice. TIC: trigeminal nerve injury.

