
Figure 8.
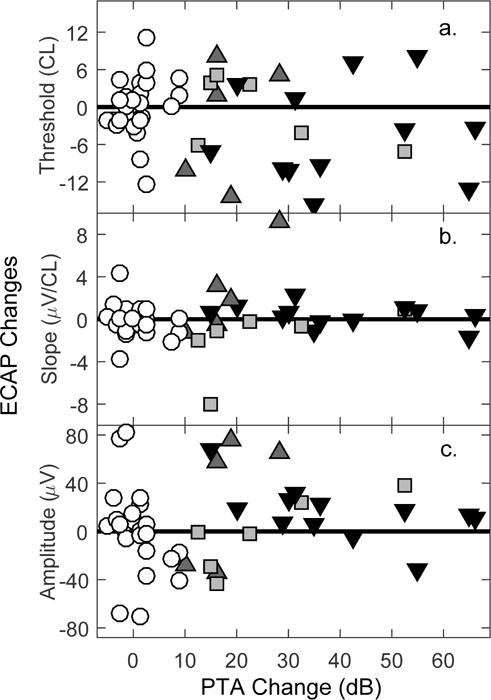
Scatterplots relating changes in ECAP measures (a. threshold, b. slope, c. amplitude) to changes in PTA. Symbols denote hearing loss category (white circles: stable; light gray squares: symmetrical; dark gray triangles: gradual; black triangles: precipitous).