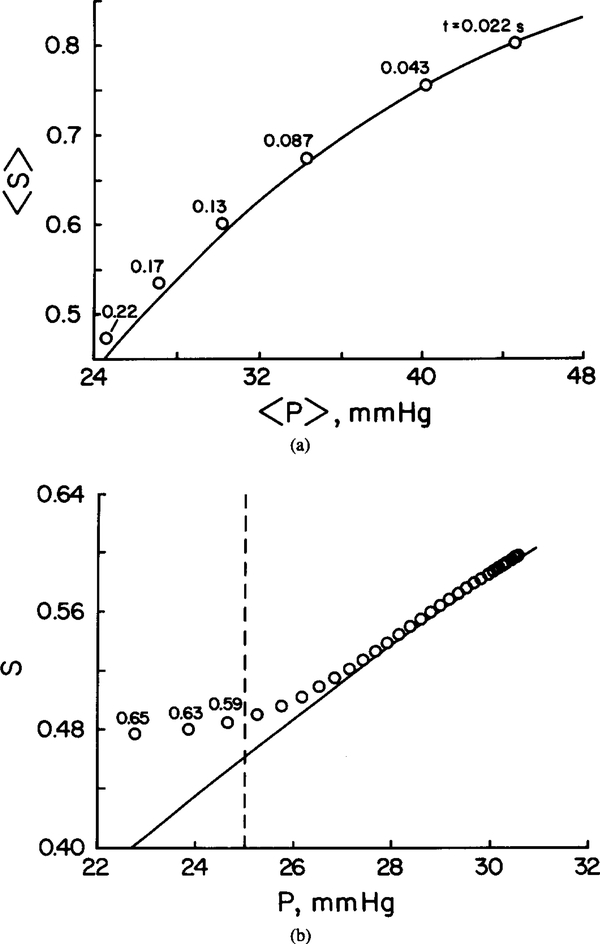
FIG. 5.
Deviation from local chemical equilibrium for θ = 10. Solid lines: Equilibrium curve. (a) Spatially averaged Hb saturation, 〈 S⟩, versus spatially averaged oxygen tension 〈 P ⟩. The numbers on the reaction path diagram correspond to RBC residence time in seconds. (b) Hemoglobin saturation versus local at t = 0.22 s. Points to the left of dashed line deviate from equilibrium by more than 5%. These local data points were obtained from the radial profiles along line E–F of Figure 2b. The numbers on the reaction path diagram correspond to the radial coordinate r.

