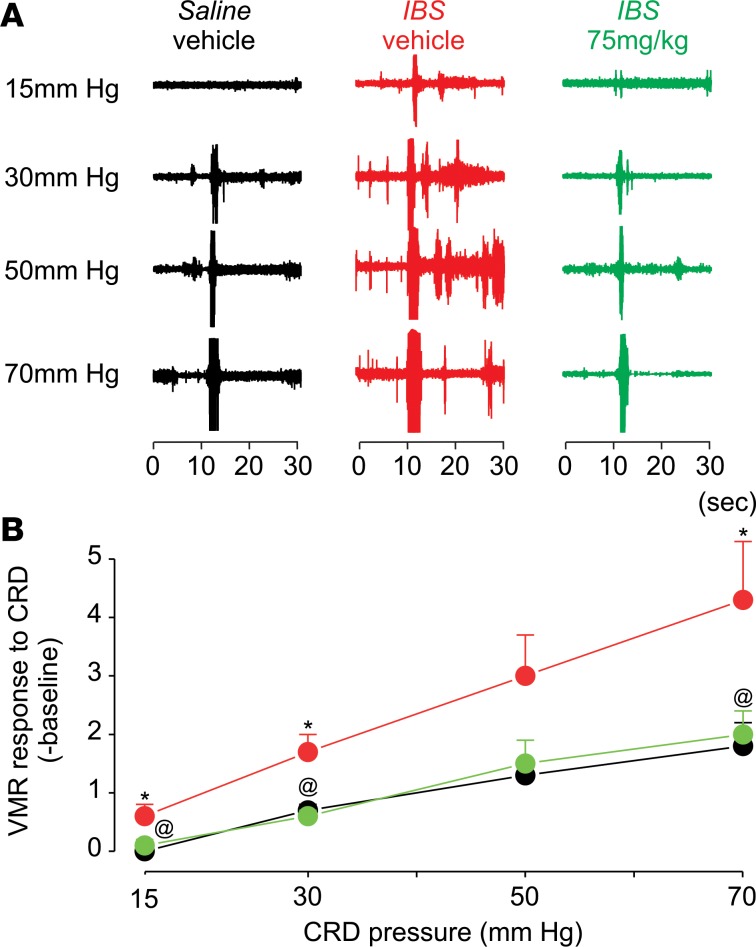
Figure 6. Effect (s.c.) of Compound B in an acetic acid–induced IBS mouse model.
(A and B) Effect on hyperalgesia of s.c. Compound B treatment in an IBS mouse model measured by VMR response to CRD. Data are presented as mean ± SEM. *P < 0.05, significantly different from saline-vehicle at same pressure; @P < 0.05, significantly different from IBS-vehicle (Student Newman-Keuls post hoc test). Two-way ANOVA analysis showed the main effect of treatment F(2,56) = 14.02, P < 0.001; main effect of pressure F(3,56) = 17.61, P < 0.001; interaction of treatment x pressure F(6,56) = 1.13, P = 0.35 (n = 7); these P values were obtained from the 2-way ANOVA test for the data shown in the figure.

