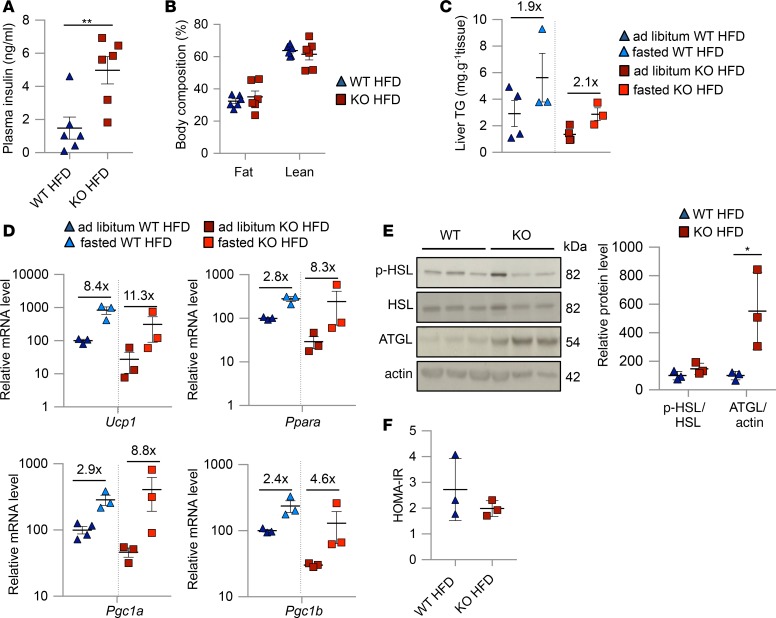
Figure 6. Visceral adipose tissue (VAT) of 14-week HFD-fed ASKO mice responded to 16-hour fasting–induced lipolysis and thermogenic gene activation.
(A and B) Plasma insulin levels (blood collected from tail in the dark phase) (A) and body composition (B) of mice fed HFD for 8 weeks (n = 6/group, mean ± SEM). (C) Liver triglyceride (TG) levels of HFD-fed WT and ASKO mice in nonfasted and fasted states (n = 3–4/group, mean ± SD). (D) mRNA levels of thermogenic genes of perirenal fat of HFD-fed WT and ASKO mice (n = 3–4/group, mean ± SD). (E) Western blot analysis of p-HSL, HSL, ATGL, and actin in mesenteric fat of fasted HFD-fed WT and ASKO mice. Results presented as relative protein levels of p-HSL and ATGL after normalization to corresponding HSL and actin (n = 3/group, mean ± SD). (F) Insulin resistance determined using homeostatic model assessment (HOMA-IR) index. HOMA-IR was calculated by multiplying 16-hour fasting insulin (μU/ml) with 16-hour fasting glucose (mmol/l) and dividing by 22.5 (n = 3/group, mean ± SD). *P < 0.05, **P < 0.01, HFD-fed ASKO versus HFD-fed WT by Welch’s unpaired t test (A, B, E, and F). In C and D, data of ad libitum HFD-fed mice are also shown in Figure 4, A and G.

