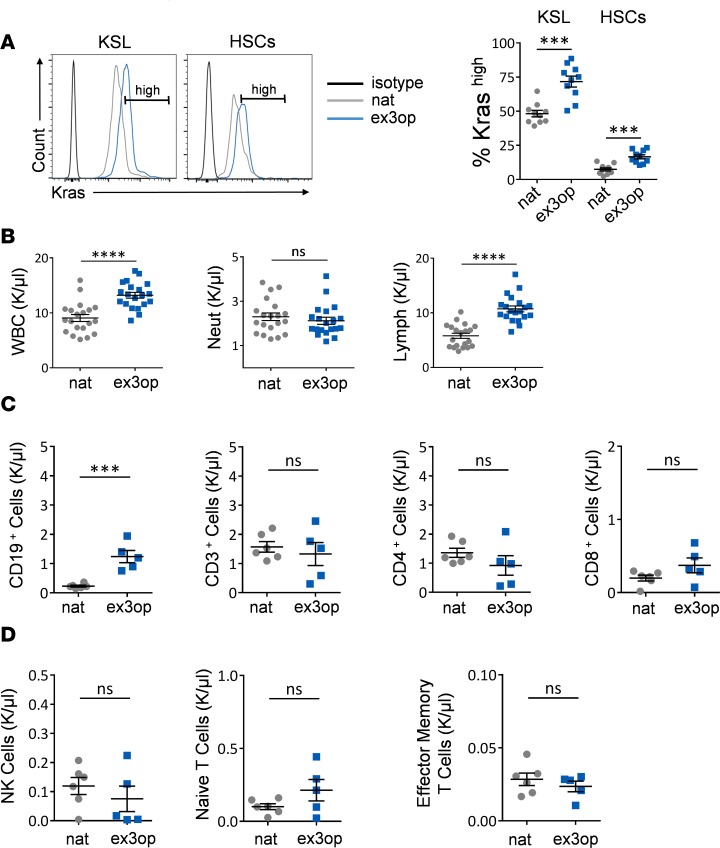
Figure 1. Kras translation is constrained by rare codons and increased Kras expands B lymphocytes.
(A) At left, representative histograms of Kras protein levels in BM KSL cells and HSCs in 8- to 12-week-old Krasex3op/ex3op mice (ex3op) and Krasnat/nat mice (nat). Isotype control is shown in black. Gate represents Krashi cells. At right, mean percentages of Krashi cells are shown within each mouse group (n = 9/group). ***P < 0.001. (B) Scatter plots show mean PB white blood cells (WBCs), neutrophils (Neut), and lymphocytes (Lymph) at baseline in 8- to 12-week-old Krasex3op/ex3op and Krasnat/nat mice (n = 20/group). ****P < 0.0001. (C and D) Scatter plots show the numbers of PB CD19+ B cells, CD3+ T cells, CD4+ T cells, CD8+ T cells, NK cells, naive T cells, and effector memory T cells (n = 8/group). ***P < 0.001. Two-tailed Student’s t test was used for each comparison. ns, not significant. Data are presented as mean ± SEM.

