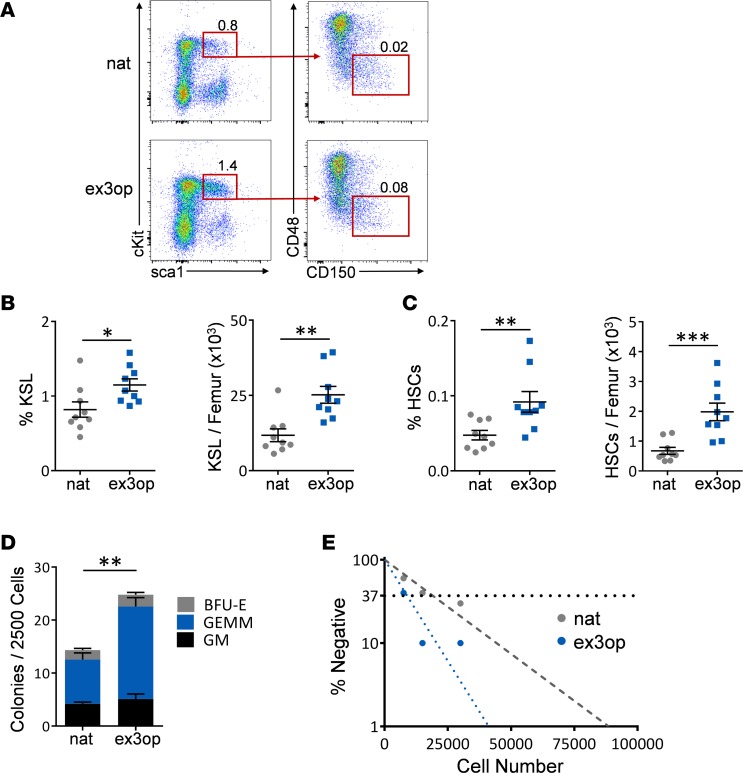
Figure 2. Krasex3op/ex3op mice display increased BM HSCs and progenitor cells.
(A) Representative flow cytometric analysis of BM ckit+sca1+lin– (KSL) cells and CD150+CD48–KSL HSCs in ex3op mice and nat mice at baseline. Numbers represent the percentages of KSL cells and CD150+CD48–KSL cells shown within the gates. (B) Mean percentages of BM KSL cells and numbers of KSL cells in ex3op mice and nat mice at baseline (n = 9/group). *P < 0.05, **P < 0.01. (C) Mean percentages of BM HSCs and numbers of HSCs in ex3op mice and nat mice (n = 9/group). **P < 0.01, ***P < 0.001. (D) Mean numbers of CFCs in ex3op mice and nat mice (n = 10/group). **P < 0.01. (E) Poisson statistical analysis of a limiting-dilution assay revealed BM LTC-IC frequencies of 1 in 8,940 in ex3op mice and 1 in 19,235 in nat mice at 8–12 weeks. The plot shows the percentage of negative colonies detected at 3 different BM cell doses. The horizontal line represents the cell dose at which 37% of the plates show no colonies (n = 6/group). P = 0.03. Two-tailed Student’s t test performed throughout. Data are presented as mean ± SEM.

