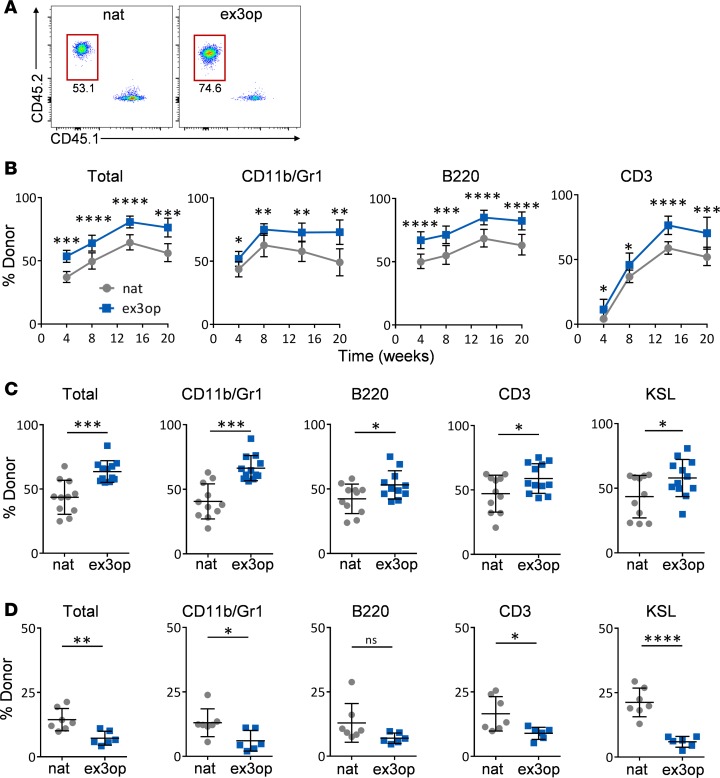
Figure 3. Increased wild-type Kras expands HSCs and exhausts long-term repopulating HSCs.
(A) Representative flow cytometric analysis of donor CD45.2+ hematopoietic cell engraftment in the PB of recipient CD45.1+ mice at 20 weeks following transplantation of 2 × 10⁵ BM cells from ex3op mice or nat mice, along with 2 × 10⁵ competitor CD45.1+ BM cells. Numbers represent percentages in each gate. (B) Panels show the mean percentages (± SD) of total donor CD45.2+ cells and donor CD45.2+ cells within the CD11b+ myeloid population, B220+ B cells, and CD3+ T cells in the PB of CD45.1+ recipient mice over time following competitive transplantation of BM cells from ex3op mice (CD45.2+) or nat mice (CD45.2+) (n = 12/group). *P < 0.05, **P < 0.01, ***P < 0.001, ****P < 0.0001. (C) Mean percentages (± SD) of total donor CD45.2+ cells and donor CD45.2+ cells within the BM CD11b+ myeloid population, B220+ B cells, CD3+ T cells, and KSL population in CD45.1+ recipient mice at 20 weeks following competitive transplantation of BM cells from ex3op mice or nat mice (n = 12/group). *P < 0.05, ***P < 0.001. (D) Panels show the percentages of donor (DsRed+) total cell engraftment, as well as donor cell engraftment within CD11b+ myeloid cells, B220+ B cells, CD3+ T cells, and KSL cells in the BM of secondary recipient (Ds-Red negative) mice at 16 weeks following competitive transplantation of 1 × 10⁶ BM cells collected from primary recipient mice. Primary recipient (Ds-Red negative) mice were transplanted with 2 × 10⁵ BM cells from Krasex3op/ex3op (Ds-Red positive) mice or Krasnat/nat (Ds-Red positive) mice, along with 2 × 10⁵ competitor (DsRed-negative) BM cells (n = 7/group). *P < 0.05, **P < 0.01, ****P < 0.0001. Data are presented as mean ± SD. Two-tailed Student’s t test was used for all analyses.

