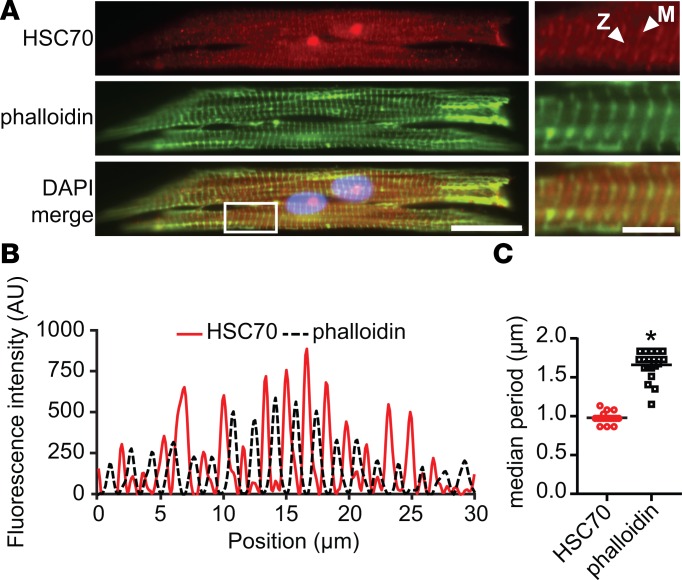
Figure 4. HSC70 is expressed in the sarcomere in NRVMs.
(A) Representative immunofluorescence micrograph of untransduced NRVM. HSC70 localizes in sarcomeric striations in row-patterned NRVMs, occurring in a prominent band at the M-line and a weak band at the Z-disk (arrowheads). M-line signal exhibits an alternating pattern with phalloidin (actin) staining. Scale bars: 20 μm and 5 μm (inset). Original magnification, ×60. (B) Representative baseline-corrected fluorescence intensity profiles for HSC70 and phalloidin taken from a line scan of the cell pictured in A. Strong HSC70 peaks coincide with phalloidin (Z-disk) troughs; weak HSC70 peaks coincide with phalloidin peaks. (C) Median frequency of HSC70 and phalloidin peaks as determined by fast Fourier transform analysis of intensity profiles from n = 18 cells. HSC70 signal repeats every 1 μm, approximately twice as often as phalloidin, reflecting both M-line and Z-disk localization. Mean ± SEM, *P < 0.0001 by Wilcoxon’s signed-rank test.

