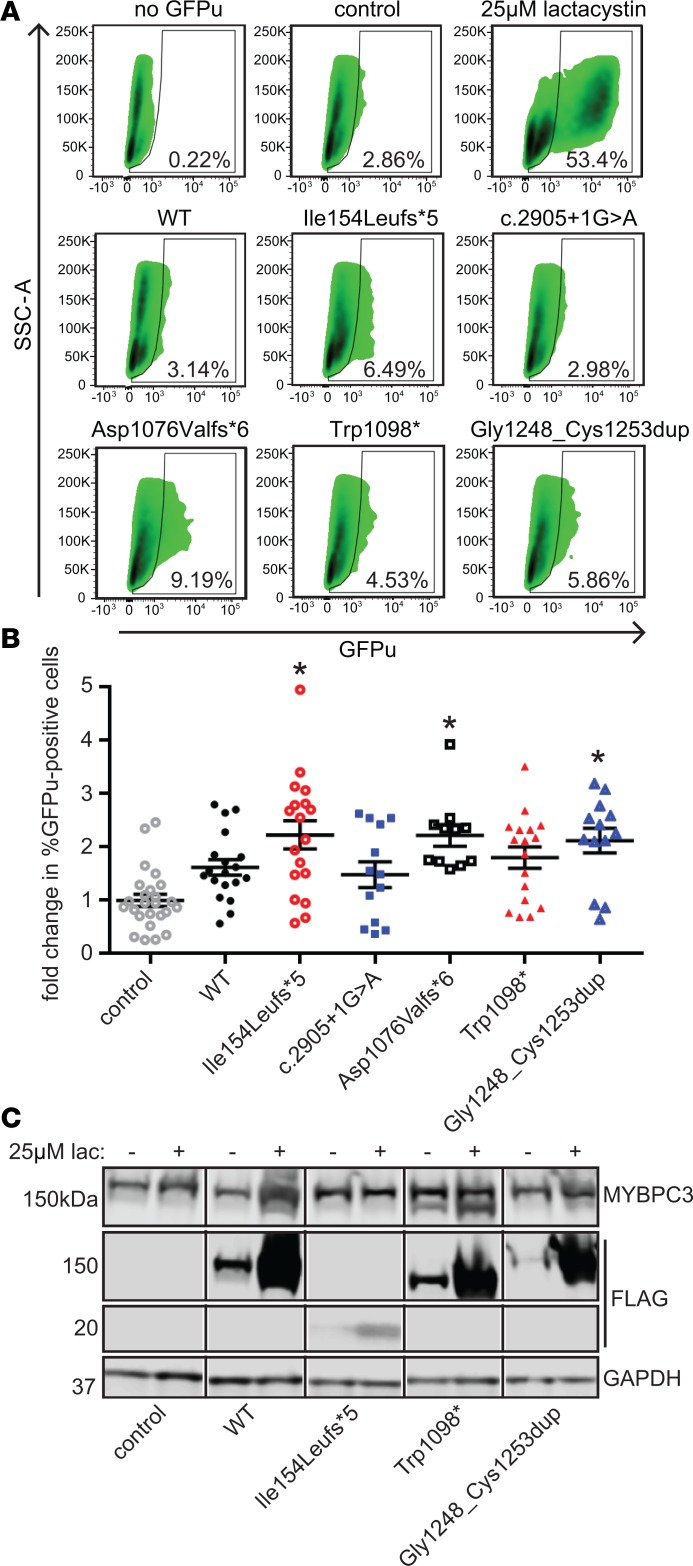
Figure 5. Expression of MYBPC3 mutants does not significantly affect ubiquitin-proteasome function as assessed by the degron reporter GFPu.
(A) Representative flow cytometry density plots. x axis, GFPu fluorescence; y axis, side scatter area (SSC-A). Data in the boxed area indicate GFP-positive cells. (B) Quantification of GFPu expression. Data are normalized to percentage GFPu-positive cells for control (untransduced) NRVMs. Mean ± SEM, n ≥ 11. Kruskal-Wallis 1-way ANOVA P < 0.0001. *P < 0.05 versus control by Dunn’s multiple-comparison test. (C) Representative Western blot of NRVMs expressing MYBPC3 constructs with and without treatment with 25 μM proteasome inhibitor lactacystin. Black line between lanes indicates noncontiguous samples from the same blot. Degradation of adenovirally expressed WT and mutant MYBPC3 is inhibited by lactacystin, while endogenous rat WT MYBPC3 levels were not significantly affected.

