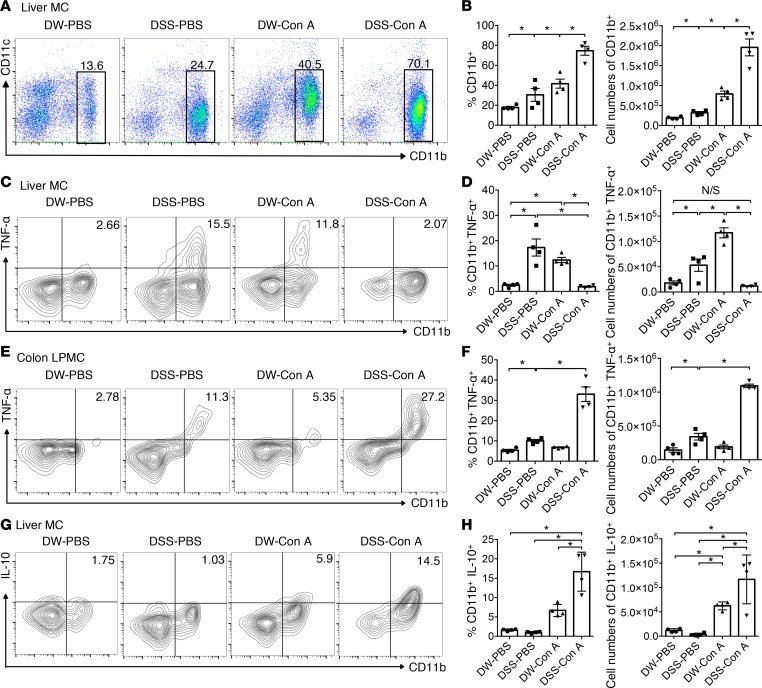
Figure 2. Liver DSS–Con A monocyte–derived macrophages display decreased TNF-α production and potentially increased IL-10 production upon LPS stimulation in vitro, and antigen-presenting potential in hepatic macrophages is reduced following DSS–Con A treatment.
(A) Representative CD11b and CD11c staining of whole liver mononuclear cells (MCs) isolated from each experimental group. Each box and number indicates the population and the percentage of CD11b+ cells in whole liver MCs. (B) Percentage (left) and number (right) of CD11b+ cells in whole liver MCs of each experimental group (n = 4/group). (C) Representative surface CD11b and intracellular TNF-α staining of whole liver MCs isolated from each experimental group after 4 hours of LPS stimulation. Each number indicates the percentage resident in whole liver MCs. (D) Percentage and number of TNF-α+CD11b+ cells in the livers of mice from each experimental group (n = 4/group). (E) Representative surface CD11b and intracellular TNF-α staining of whole lamina propria MCs isolated from each experimental group after 4 hours of LPS stimulation. Each number indicates the percentage resident in whole lamina propria MCs. (F) Percentage and number of TNF-α+CD11b+ cells in the colon lamina propria of each experimental group (n = 4/group). (G) Representative surface CD11b and intracellular IL-10 staining of whole liver MCs isolated from each experimental group after 4 hours of LPS stimulation. Each number indicates the percentage in whole liver MCs. (H) Percentage and number of IL-10+CD11b+ cells in the livers of mice from each experimental group (n = 4/group). Data represent the mean ± SEM. *P < 0.05 according to 1-way ANOVA with Tukey’s multiple-comparison correction.

