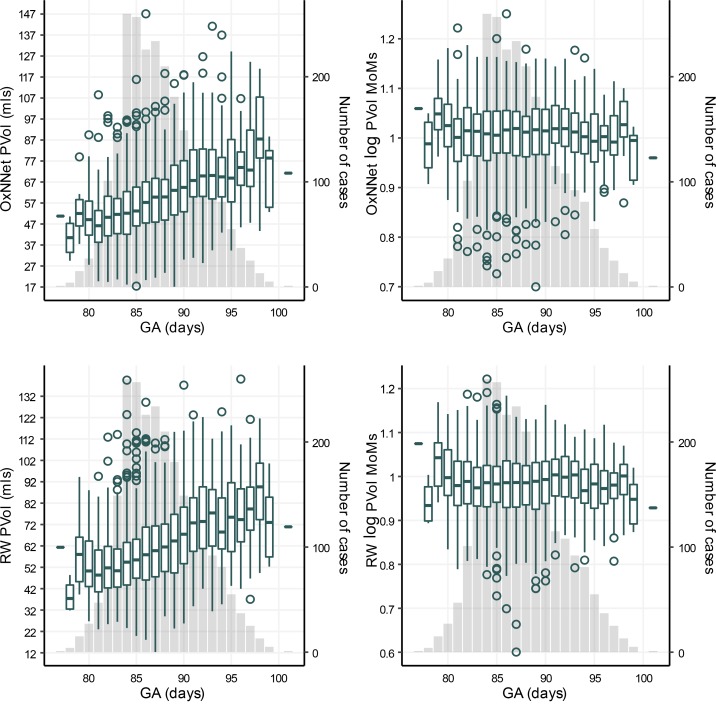
Figure 4. Placental volume and gestational age.
Box plots showing the distribution of actual placental volumes (PlVol) for OxNNet, the logarithm of the multiples of the medians (MoMs) for OxNNet, actual placental volumes (PlVol) for random walker, and the logarithm of MoMs for random walker versus the gestational age (GA). The number of cases for each GA (y axis on the right) is plotted as a column chart in the background.

