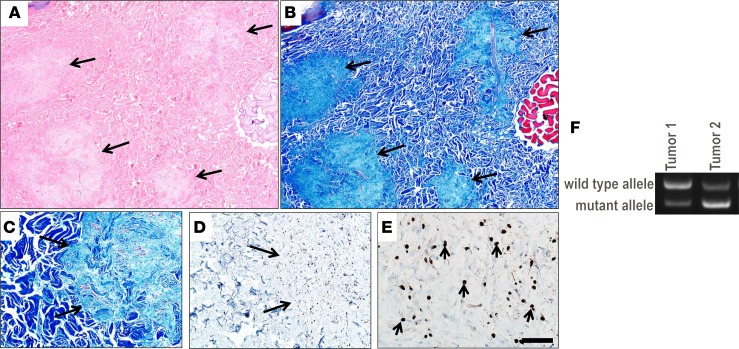
Figure 7. Histopathological examination of biopsy tissue from a NF1+/ex42del miniswine with neurofibromas.
Serial sections of a dermal mass showing multifocal neurofibromas (arrows) that efface the normal dermal collagen (A and B). While the multifocal tumors are seen using both stains, the Masson’s trichrome stain may be more useful in this specific case for seeing the changes. Serial sections (C and D) of the interface between the neurofibroma (arrows) and normal dermis (C and D). Higher magnification shows the scattered S100+ immunostaining (arrows) within the neurofibroma (E). H&E stain (A), Masson’s trichrome stain (B and C), and S100 IHC with hematoxylin counterstain (D and E). Scale bar: 600 μm (A and B), 185 μm (C and D) or 45 μm (E), respectively. A–E are representative of 6 total tumors analyzed from 2 animals. (F) NF1 RT-PCR of 2 tumor samples from 2 NF1+/ex42del animals. One tumor sample shows relative loss of NF1 WT RNA transcript at the germline level.

