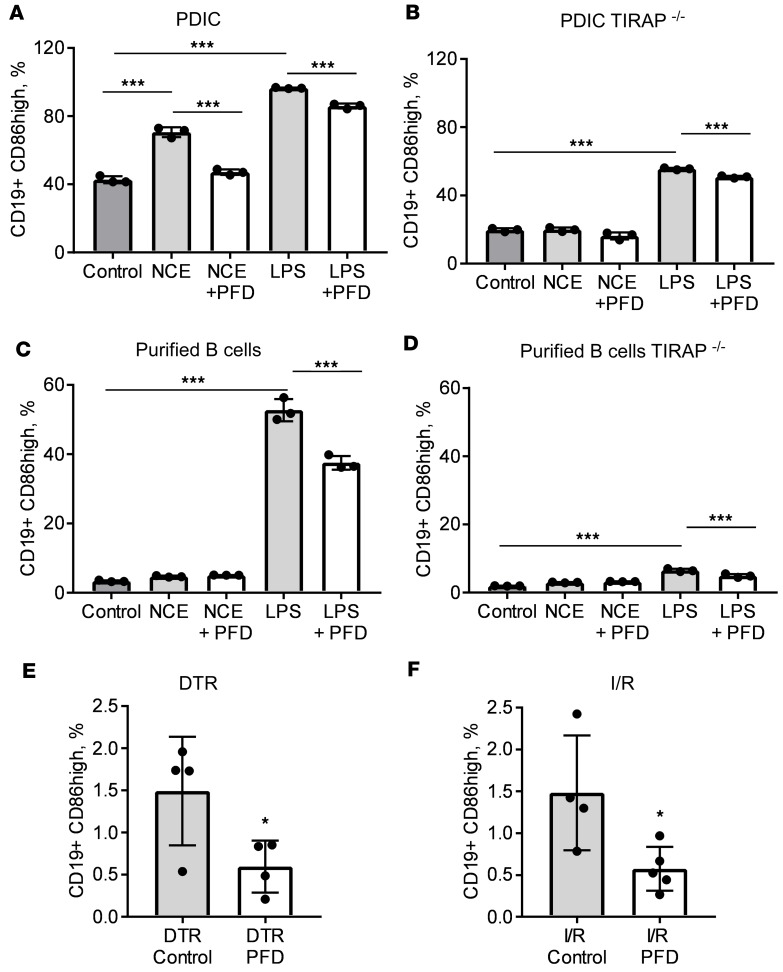
Figure 7. Analysis of B cell activation in wild-type and TIRAP-deficient immune cells.
(A and B) Unfractionated peritoneum-derived inflammatory cells (PDICs) were collected on day 4 after intraperitoneal injection of thioglycollate and placed in culture. Cells were cultured in media alone (control), in the presence of necrotic cell extracts from H9c2 cells (NCEs), in the presence of NCEs and pirfenidone (NCE-PFD), in the presence of LPS (LPS), or in the presence of LPS and pirfenidone (LPS-PFD). After 24 hours of culture, cells were collected for flow cytometric analysis and the prevalence of CD19+CD86hi cells was quantified. Three biological replicates per experiment are reported. (A) Results from inflammatory cells collected from wild-type mice. (B) Results from inflammatory cells collected from TIRAP–/– animals. (C and D) B lymphocytes were purified from the spleen and cultured for 24 hours under the same conditions described for panels A and B. After 24 hours of culture, cells were collected for flow cytometric analysis and the prevalence of CD19+CD86hi cells was quantified. Three biological replicates per experiment are reported. Panel C shows results from splenic B cells purified from wild-type mice, and panel D shows results from B lymphocytes collected from TIRAP–/– animals. (E and F) Mice were subjected to acute myocardial injury either by exposure to diphtheria toxin (DT) (E) or through 90 minutes of closed-chest ischemia followed by reperfusion (I/R) (F). Mice were fed regular chow (control) or chow enriched with pirfenidone (PFD). On day 4 after injury, the myocardium was collected and analyzed via flow cytometry to assess the number of myocardial CD19+CD86hi cells. In E, n = 4 per/group; in F, n = 4 control, n = 5 PFD. *P < 0.05, ***P < 0.001. Bars represent the mean, and error bars represent standard deviation. P values were calculated with 1-way ANOVA followed by Tukey’s test for multiple comparisons in panels A–D and with Student’s t test in panels E and F.

