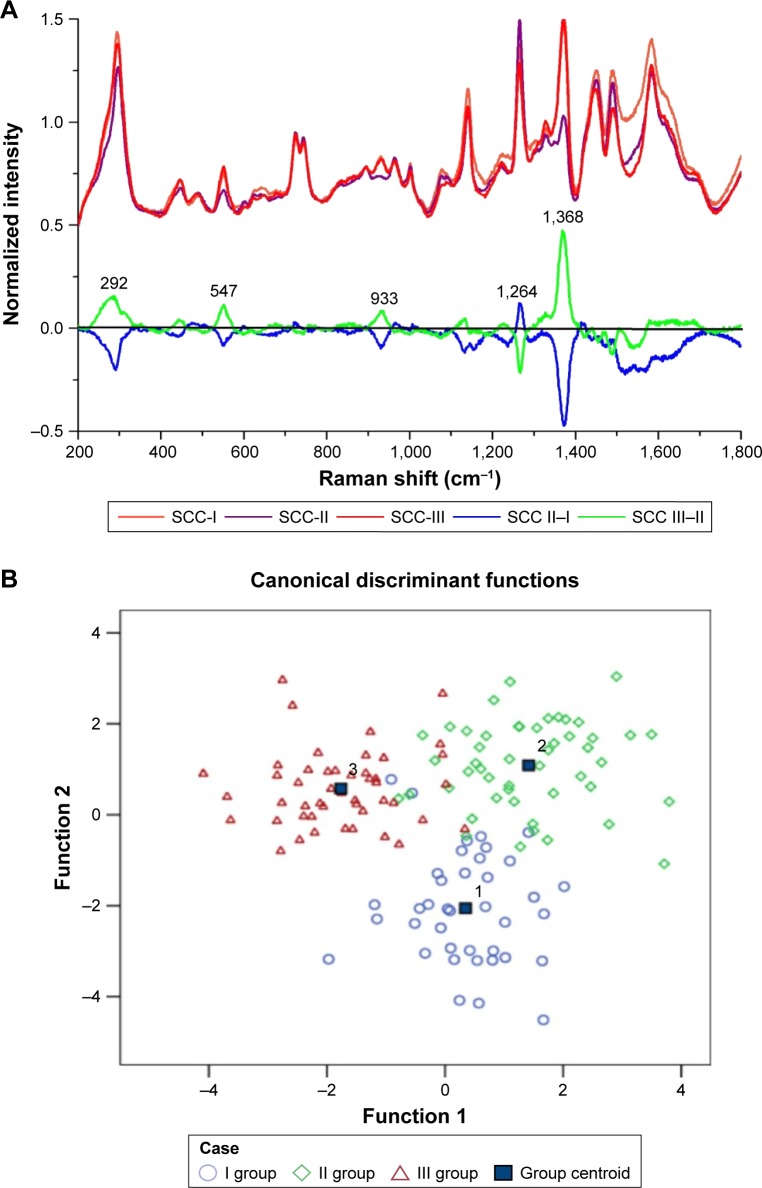
Figure 4.
(A) The normalized average SERS spectra of the SCC-I, SCC-II, and the SCC-III groups and the subtracted spectra of different SCC groups. (B) The two-dimensional scatter plot diagram of the SCC-I, SCC-II, and the SCC-III groups.
Abbreviations: SCC, squamous cell carcinoma; SERS, surface-enhanced Raman spectroscopy.

