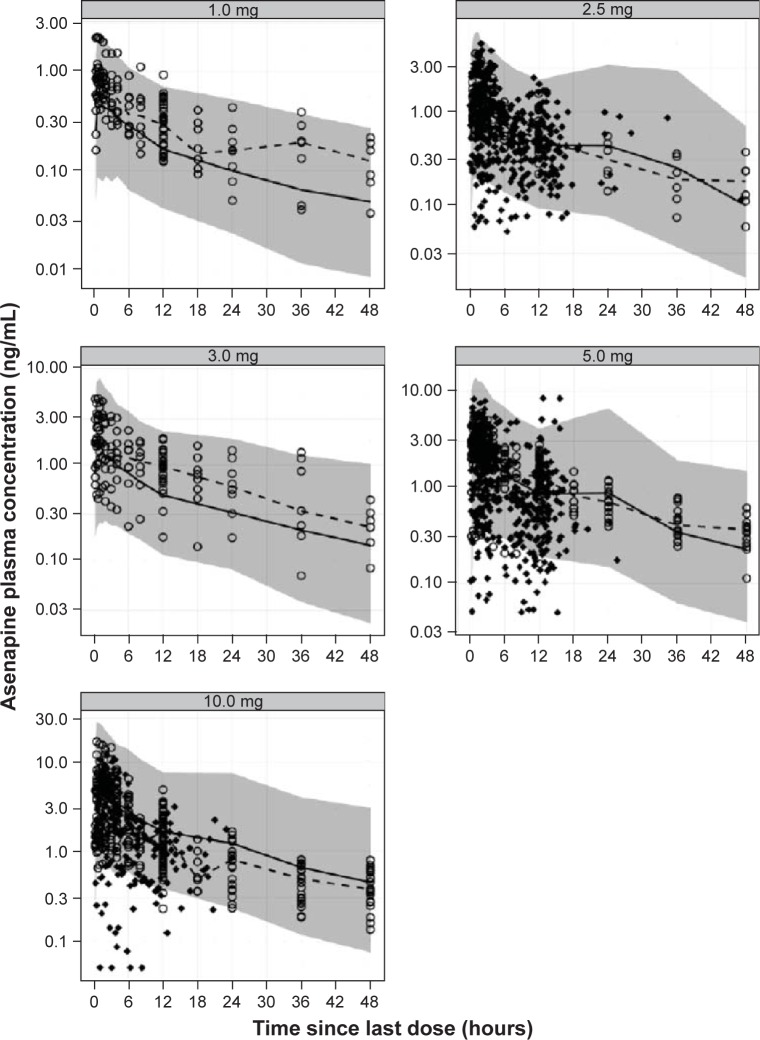
Figure 5.
Visual predictive check plots for each asenapine dose.
Notes: Adequacy of model is displayed by overlaying observations (o for Phase I studies and ♦ for Phase III studies) on model-predicted 95% prediction intervals (shaded area). Dots represent plasma-concentration data since last dose. Solid and dashed lines represent medians for binned time intervals of observations and model predictions, respectively.

