
Figure 5.
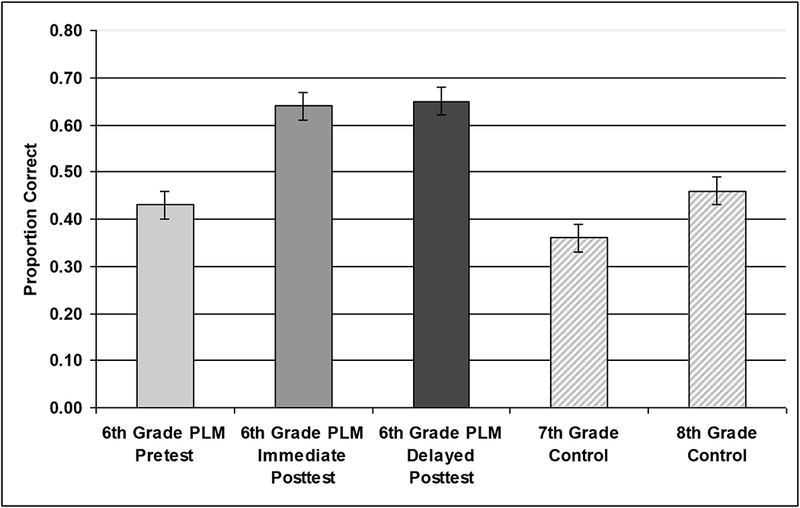
Results of Linear Measurement PLM. Pretest, posttest, and posttest accuracy after a 4-month delay on a battery of measurement and fraction problems are shown in the leftmost three columns. Seventh and 8th grade control groups are shown in the two columns to the right. Error bars indicate ± 1 standard error of the mean.