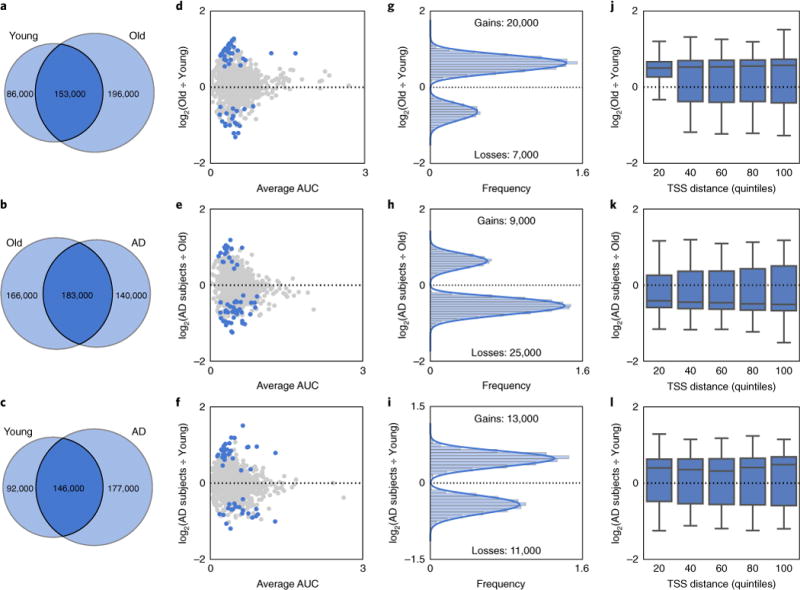
Fig. 2. H4K16ac is predominantly gained in aging and lost in AD.

a–c, Venn diagram of H4K16ac peak overlap between Young and Old (a), Old and AD subjects (b), and Young and AD subjects (c). d–f, Scatter plot of H4K16ac fold-change vs. peak size average (measured as area under the curve or AUC) for (d) Young vs. Old, (e) Old vs. AD subjects and (f) Young vs. AD subjects comparisons for peaks called in Young, Old or AD subjects. Blue dots represent peaks with significant changes (P < 0.05, Welch’s t test, two-sided) in H4K16ac enrichment. For graphical representation, 1,000 randomly chosen points are shown in each panel. g–i, Histogram of H4K16ac fold-change vs. frequency for peaks with significant (P < 0.05, Welch’s t test, two-sided) H4K16ac changes (blue dots in d–f) for (g) Young vs. Old, (h) Old vs. AD subjects and (i) Young vs. AD subjects comparisons. j–l, Boxplot of H4K16ac fold-changed based on the distance of the peak from the closest TSS ordered into quintiles for peaks with significant (P < 0.05, Welch’s t test, two-sided) H4K16ac changes (blue dots in d–f) for (j) Young to Old, (k) Old to AD subjects and (l) Young to AD subjects comparisons. Boxplots show minimum, first quartile, median (center line), third quartile and maximum.
