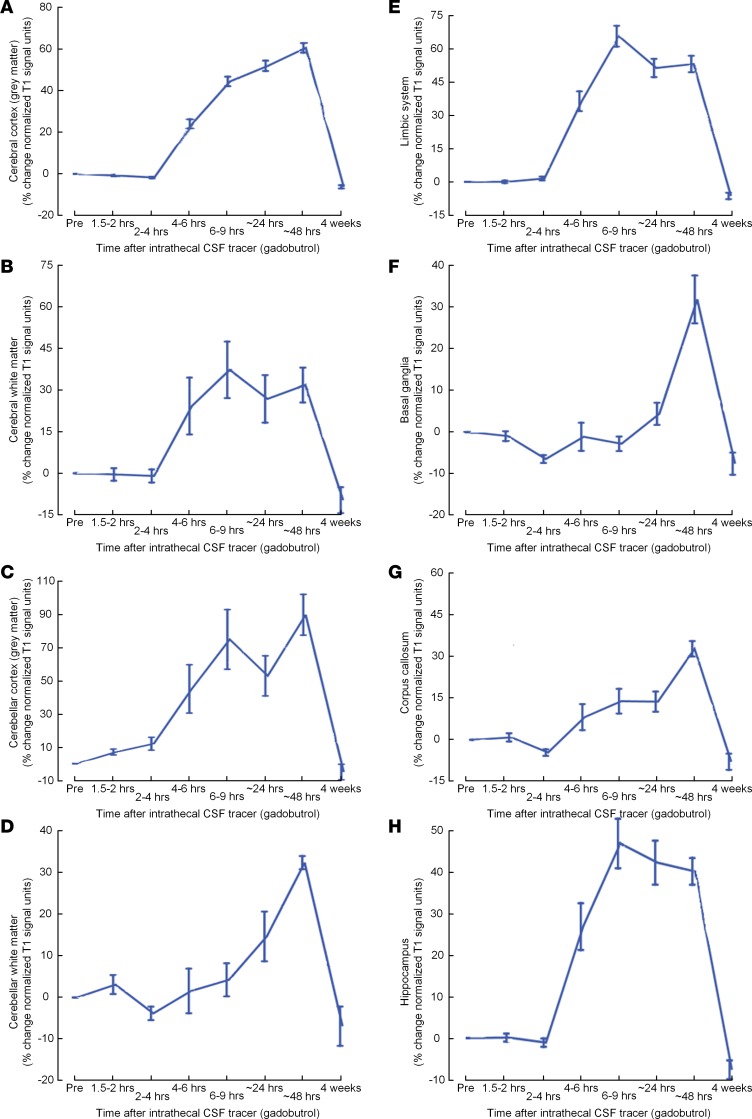
Figure 3. CSF tracer enrichment in some brain regions of the REF cohort.
Trend plots of percentage change in signal unit ratio are presented for main regions within the supratentorial and infratentorial compartments, including (A) cerebral cortex (gray matter), (B) cerebral white matter, (C) cerebellar cortex, (D) cerebellar white matter, (E) limbic system, (F) basal ganglia, (G) corpus callosum, and (H) hippocampus. Trend plots are presented with mean ± standard error (SE). n = 8.

