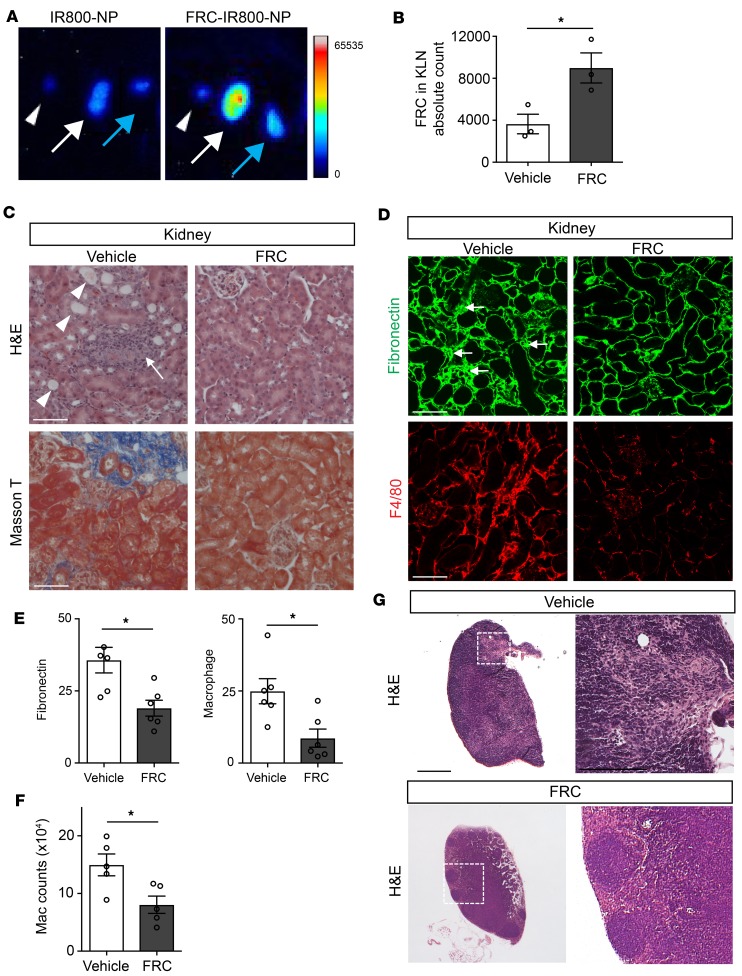
Figure 5. Injection of FRCs ameliorates chronic renal injury following repetitive IRI.
(A) IR800-NP–labeled FRCs preferentially traffic to KLN draining injured kidney (arrowhead: popliteal LN; white arrow: KLN draining ischemic kidney; blue arrow: KLN draining non-ischemic kidney). (B) Flow cytometric analysis demonstrates that injection of FRCs at time of recurrent IRI leads to increased FRC population in KLN in comparison with injection of vehicle (n = 3/group, mean ± SEM). (C) Light microscopy shows amelioration of kidney injury in mice injected with FRCs at the time of recurrent IRI, as compared with mice injected with vehicle (arrowheads: cast-filled and dilated tubules; arrow: interstitial expansion and hypocellularity). Masson’s trichrome staining shows decreased fibrosis in FRC-treated mice. Scale bars: 75 μm. (D) Substantial declines in fibronectin density and F4/80+ macrophage infiltration of kidney is observed following FRC injection at the time of recurrent IRI. Scale bars: 75 μm. (E) Semiquantitative analysis of the corresponding fluorescent signals in kidney tissue shows significantly lower signals in the FRC-treated group (n = 5–6/group, mean ± SEM). (F) Absolute count of kidney-infiltrating macrophages following IRI, as measured by flow cytometry, confirms a significant drop in macrophage recruitment with FRC treatment (n = 5/group, mean ± SEM). (G) FRC injection prevents architectural changes in KLN following IRI. Scale bars: 500 μm (left) and 200 mm (right). *P < 0.05 by Student’s t test.

