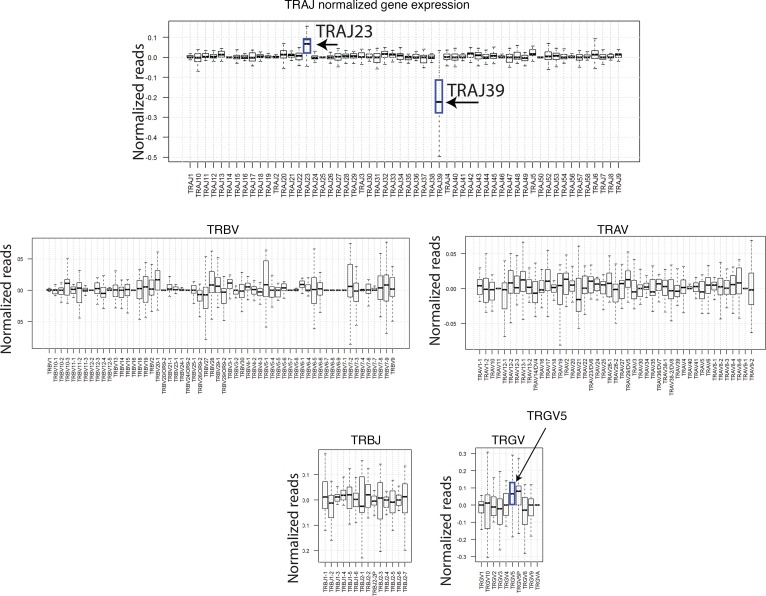
Figure 2. Paired analysis of TRAJ, TRBV, TRAV, TRBJ, and TRGV gene segment expression for lesional and nonlesional psoriasis skin.
The proportions for each TCR gene segment were calculated as described above for each skin sample. The difference between lesional and matching nonlesional samples were then calculated for each patient (from dataset in ref. 32). Median and variations are represented as box plots. Wilcoxon signed rank test for paired samples was used to estimate statistically significant differences. Gene segments TRAJ23, TRAJ39, and TRGV5 (P = 1.33 × 10⁻⁵, P = 1.49 × 10⁻⁷, and P = 5.91 × 10⁻³, respectively) are designated with an arrow on the graph.

