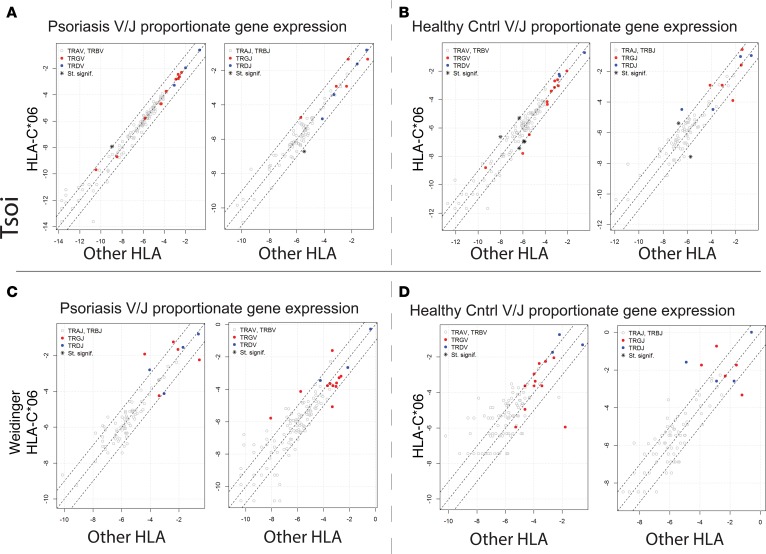
Figure 5. Lack of HLA-C*06–specific TCR gene expression signature.
(A) For psoriatic samples (Tsoi et al. dataset details [32] listed in Table 6), all the reads mapping to each TCR gene segment across HLA-C*06–positive versus all other HLA types in psoriatic individuals were pooled. The proportions for each TCR gene segment were calculated as described above. Fisher’s Exact test for count data was used to estimate statistically significant differences in the TCR segment usage. Gene segments with FDR < 0.05 and an odds ratio <0.5 or >2, are designated with an asterisk on the graph. Gene segments with statistically significant changes in their proportionate gene expression are listed in Supplemental Table 7. (B) For healthy individuals (Tsoi et al. dataset details [32] listed in Table 6), all reads mapping to each TCR gene segment across HLA-C*06–positive and all other HLA types were pooled separately. Fisher’s exact test for count data was used to estimate statistically significant differences in the TCR segment usage. Gene segments with FDR < 0.05 and an odds ratio <0.5 or >2 are designated with an asterisk on the graph. Gene segments with statistically significant changes in their proportionate gene expression are listed in Supplemental Table 8. (C and D) Analysis was repeated using the validation (Weidinger dataset details listed in Table 6) dataset for psoriasis HLA-C*06 versus all other HLA in C and for healthy control HLA-C*06 versus all other HLA in D.

