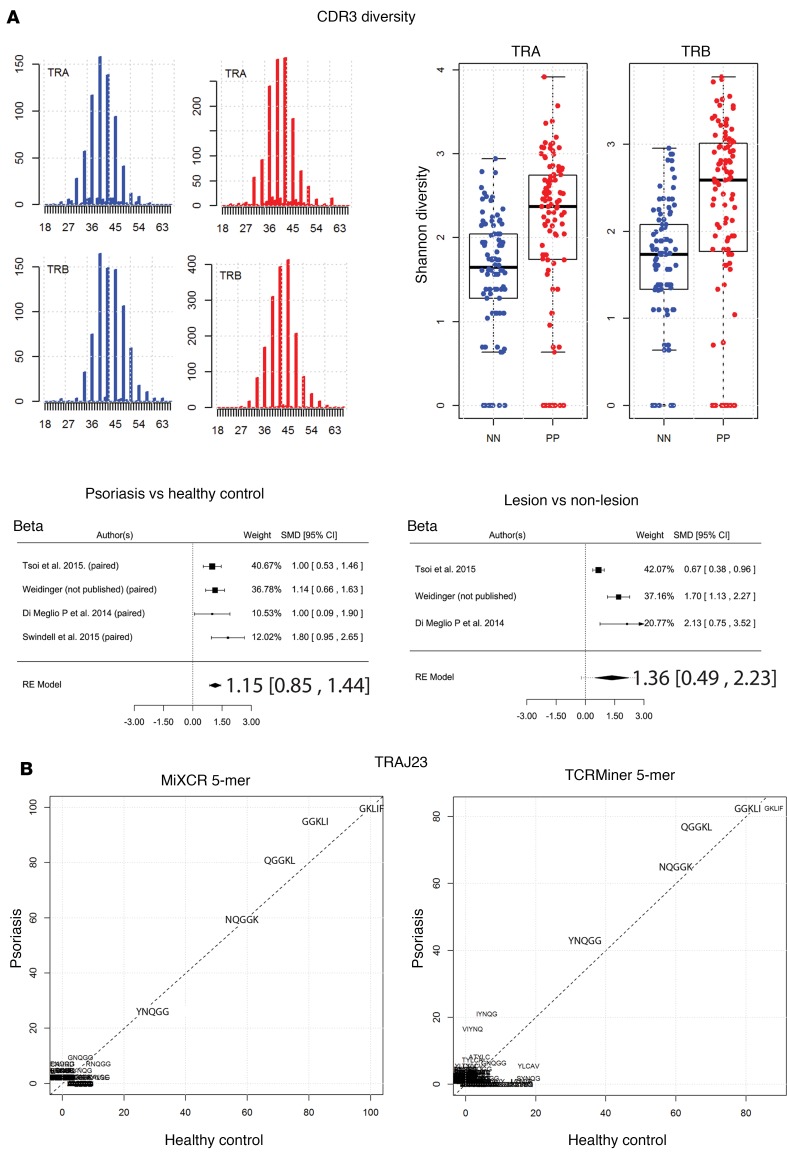
Figure 6. Increased αβ TCR repertoire diversity in psoriasis.
(A) In silico CDR3 spectratyping (distribution of clonotype frequency by CDR3 length) for the β and α chains. TCR CDR3 sequences were extracted from RNA-Seq datasets using MiXCR software, and reads for healthy (blue bars) and psoriatic individuals (red bars) were pooled. CDR3 sequence length is plotted along the x axis. The abundance of the TCR sequences is plotted on the y axis. The Shannon diversity index was then calculated for healthy (blue dots) and psoriatic (red dots) CDR3 sequences, and Wilcoxon rank sum test was used to estimate statistically significant differences in diversity; tabulated results are provided in Supplemental Table 10. Finally, a meta-analysis across all RNA-Seq datasets was used to verify the finding that psoriasis is associated with increased TCR CDR3 diversity. Forest plots of the standardized mean difference of TRB CDR3 diversity (psoriasis versus healthy control and psoriasis lesion versus nonlesional skin) are shown. Each black box is representative of the study weight for each data set, and horizontal lines are 95% CI. Diamonds represent standardized mean differences for results of all studies combined. Extremes of diamonds give 95% CI. (B) Full and partial CDR3 sequences from reads containing TRAJ23 were extracted using MiXCR or TCRminer. Amino acid sequences were analyzed using R package tcR. Common TRAJ23-encoded 5-mer sequences are presented. Both MiXCR and TCRminer yielded similar sequences, which did not differ significantly between psoriasis and healthy controls.

