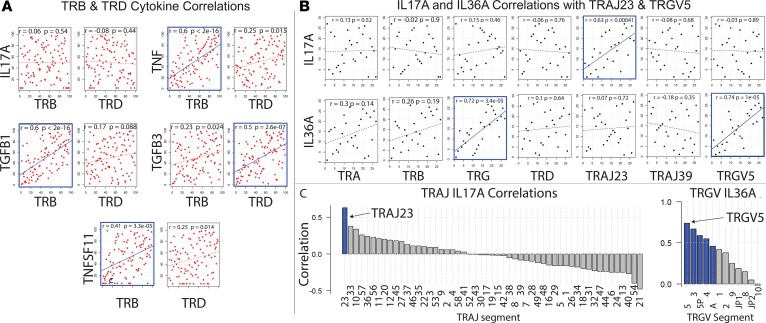
Figure 8. TCR gene correlations with psoriasis-associated cytokines.
(A) Correlation of gene expression of TRB within psoriatic plaques with psoriasis-associated cytokines in the discovery RNA-Seq dataset (Tsoi et al. dataset details [32] listed in Table 6). Spearman correlation coefficients and P values are displayed on each plot. P values for Spearman’s test were calculated using the asymptotic t approximation. Significant correlations are outlined in blue. (B) Paired correlation analysis (psoriasis lesion versus matching nonlesion samples) in discovery RNA-Seq dataset. Differences in gene expression were calculated (normalized gene expression of nonlesion samples were subtracted from normalized gene expression of matching lesion samples). Then, the Spearman correlation coefficient was calculated for the difference in gene expression. Correlation coefficients and P values are displayed on each plot. P values for Spearman’s test were calculated using the asymptotic t approximation. Significant correlations (P < 0.05) are outlined in blue. (C) Waterfall plots depicting IL-17A correlations for all TRAJ and TRGV gene segments in discovery RNA-Seq dataset. Differences in gene expression were calculated (normalized gene expression of nonlesion samples were subtracted from their corresponding values of matching lesion samples). Then, Spearman correlation coefficients for differences in gene expression were calculated. Spearman correlation coefficients are depicted on the y axis. TRAJ or TRGV gene segments are separated on the x axis. P values for Spearman’s test were calculated using the asymptotic t approximation. Significant correlations (P < 0.05) are highlighted in blue.

