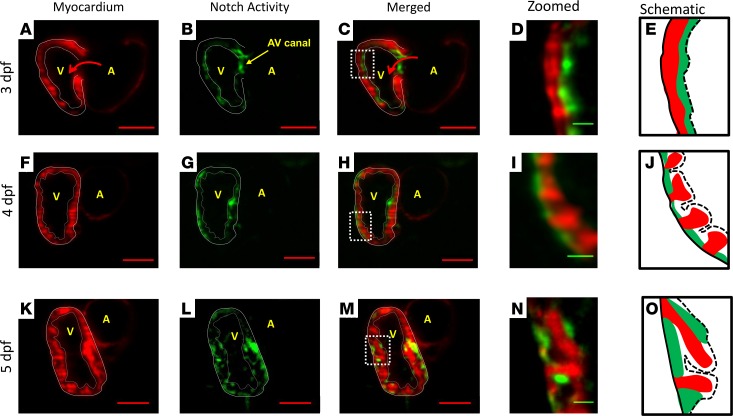
Figure 4. Sequential Notch activity from endocardium to trabecular grooves in the WT zebrafish embryo.
Our 4D LSFM imaging captured sequential Notch1b activation (green) from endocardium to epicardium in the transgenic Tg(Tp-1:GFP;cmlc:mcherry) line. (A–E) At 3 dpf, Notch1b activity localized to the endocardial layer and AV canal. (F–J) At 4 dpf, Notch activity located primarily in the epicardium versus in the endocardium. Epicardial Notch1b activity and trabecular ridges organized into an alternating pattern. (K–O) At 5 dpf, trabeculae developed into a network structure. Notch activity was prominent in both the endocardium and trabecular grooves. Red scale bar: 50 μm. Green scale bar: 10 μm. Dotted lines in E, J, and O indicate endocardium. Solid lines in E, J, and O indicate epicardium. n = 3.

