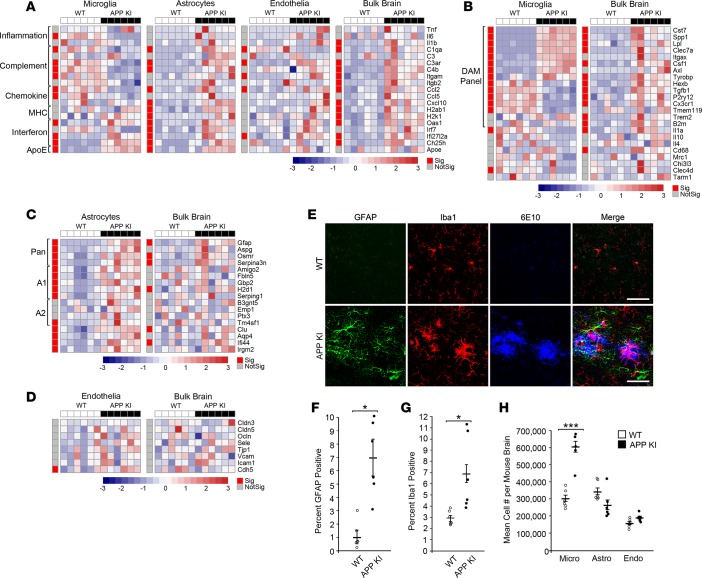
Figure 5. Cell type–specific response to amyloid pathology in APP NL-G-F knockin mice.
(A–D) Heatmap of qRT-PCR data from concurrent brain cell type acquisition–isolated (CoBrA-isolated) microglia, astrocytes, and vascular endothelia, with comparison to that of bulk brain. (A) Gene expression profiles of microglia, astrocytes, vascular endothelia, and bulk brain against selected genes involved in inflammation, complement, chemokine, MHC, interferon pathways, and ApoE. (B–D) Comparison of genes specific to microglia (B), astrocyte (C), and vascular endothelia (D) between CoBrA-isolated cell types and bulk brain. Sig., P < 0.05 (red); Not Sig., P ≥ 0.05 (gray), t test. The red-and-blue scale bar represents the Z-score, the deviation from the mean by standard deviation units. (E) Representative confocal microscopy images of brain tissue from APP NL-G-F knockin (APP KI) mice and wild-type littermates at 9 months. Green, GFAP; red, Iba1; and blue, 6E10. Scale bar: 50 microns. (F) Quantitation of GFAP+ signal. n = 6/group. (G) Quantitation of Iba1 + signal. n = 6/group. (H) Mean cell number isolated per mouse forebrain by FACS from wild-type and APP KI mice. n = 6/group. Micro, microglia; Astro, astrocytes; Endo, vascular endothelia. ***P < 0.001, t test.

