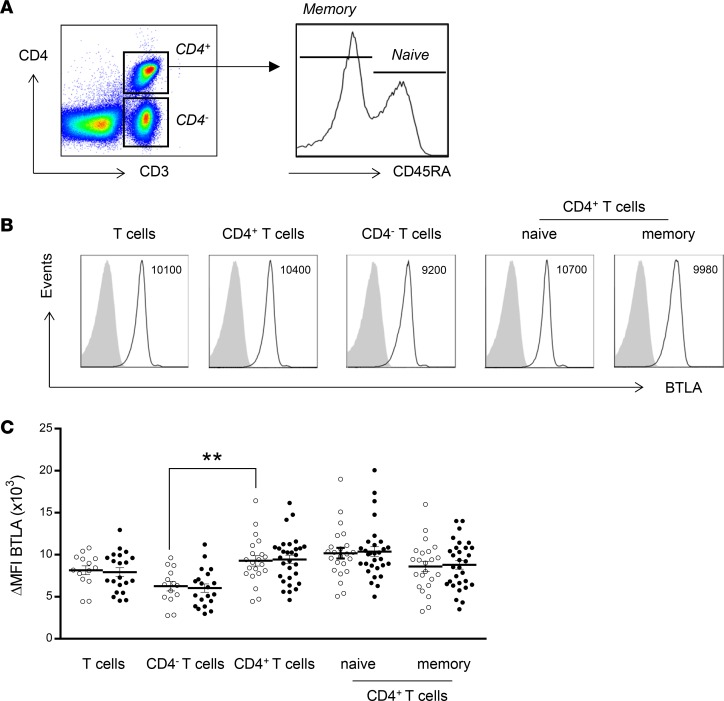
Figure 1. Expression of BTLA by T cells in SLE patients compared with that in HCs.
(A) Flow cytometry gating strategy of different T cell subsets defined, by CD3, CD4, and CD45RA. (B) Flow cytometry analysis of BTLA expression on human T cell subsets. Data from a representative HC are shown as an example. MFI values are indicated. (C) Comparison of BTLA expression on T cell subsets in HCs (white dots) and SLE patients (black dots). Results are expressed as ΔMFI, corresponding to BTLA MFI – isotype MFI. Horizontal lines represent the mean BTLA expression for HCs (n = 14–21) and SLE patients (n = 21–30). **P < 0.01; unpaired t test.

