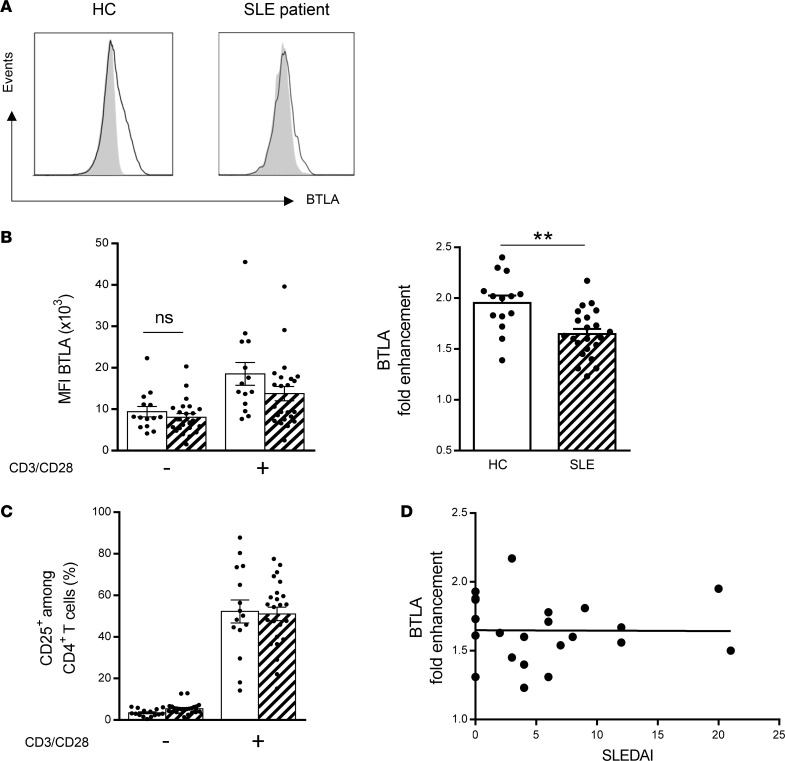
Figure 2. The upregulation of BTLA expression upon activation is defective in lupus CD4+ T cells in SLE patients compared with that in HCs.
(A) Flow cytometry analysis of BTLA expression on CD4+ T cells with (black lines) or without stimulation (gray peaks) in a representative HC and SLE patient. (B) Comparison of BTLA MFI and BTLA fold enhancement (expressed as a ratio of BTLA MFI following activation/BTLA MFI in the absence of activation) on CD4+ T cells from HCs (n = 14; white bars) and SLE patients (n = 22 hatched bars). (C) Comparison of CD25 expression following T cell activation (with anti-CD3 and anti-CD28 mAbs) in CD4+ T cells from HCs (white bars, n = 15) and SLE patients (hatched bars, n = 24). (D) Correlation between BTLA fold enhancement and the disease activity defined by SLEDAI (n = 22). Results are expressed as mean ± SEM, and each dot represents one individual. **P < 0.01, Mann-Whitney; r, Spearman correlation coefficient.

