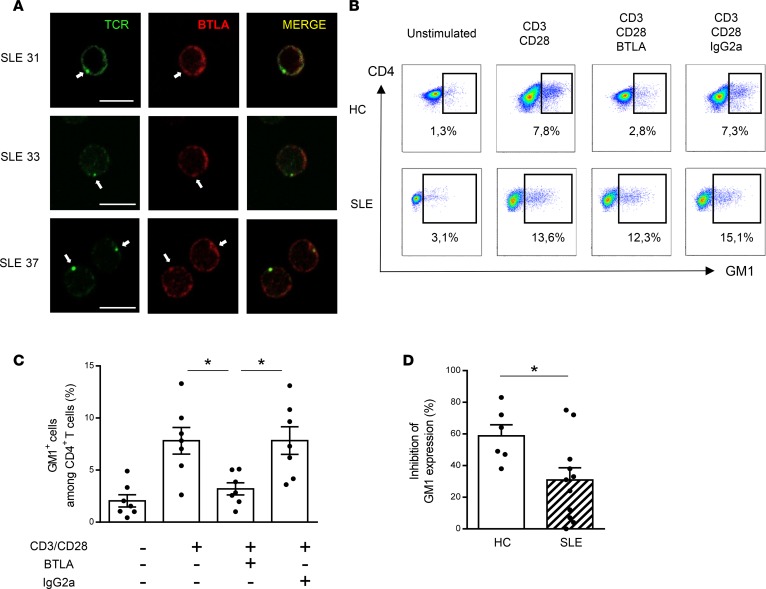
Figure 6. BTLA regulates GM1 expression in activated T cells.
(A) Unstimulated lupus CD4+ T cells were stained for TCR (in green) and BTLA (in red) and analyzed by confocal microscopy. Preclustered TCRs are denoted by white arrows. Scale bar: 10 μm. (B) Purified CD4+ T cells were cultured for 48 hours with or without TCR stimulation (anti-CD3/anti-CD28 mAbs) in the presence of the agonistic anti-BTLA mAb or its isotype control (IgG2a). GM1 expression was measured by flow cytometry thanks to CTB staining. Data obtained with CD4+ T cells from one representative HC and one representative SLE patient are shown. (C) Percentage of GM1+ cells among CD4+ T cells from HCs (n = 6). (D) Comparison of the percentage of inhibition of GM1 expression in HCs (n = 6; white bar) and SLE patients (n = 11; hatched bar). Results are expressed as mean ± SEM, and each dot represents one individual. *P < 0.05; ANOVA/Tukey comparison (C) and Mann-Whitney (D).

