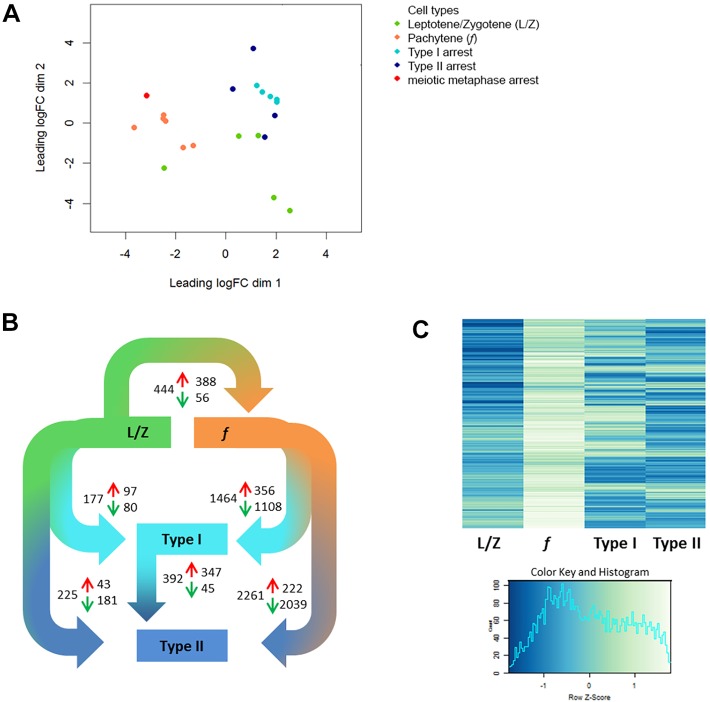
Fig. 3.
Transcriptomic analysis of fertile (f), type I and II spermatocytes. (A,B) Multidimensional scaling of leptotene/zygotene spermatocytes (L/Z, green) and pachytene spermatocytes (f, orange) from fertile men (data taken from Jan et al., 2017) alongside type I (turquoise), type II (dark blue) and meiotic metaphase (metaphase, red) arrested spermatocytes (A) and differential gene expression analysis (adjusted P-value<0.05; B) reveal distinct transcriptomic profiles for type I and II arrested spermatocytes. Depicted in B are comparisons between leptotene/zygotene (L/Z) and pachytene spermatocytes from fertile men; pachytene spermatocytes from fertile men and type I and II arrested spermatocytes; leptotene/zygotene (L/Z) and type I and II arrested spermatocytes; and, finally, between type I and type II arrested spermatocytes. The total number of DEGs for every comparison are shown as well as the number of genes upregulated (red arrows) and the number of genes downregulated (green arrows). (C) Analysis of genes upregulated during the leptotene/zygotene to pachytene transition in normal spermatogenesis reveals a leptotene/zygotene-like expression pattern in type I and II arrested spermatocytes.

