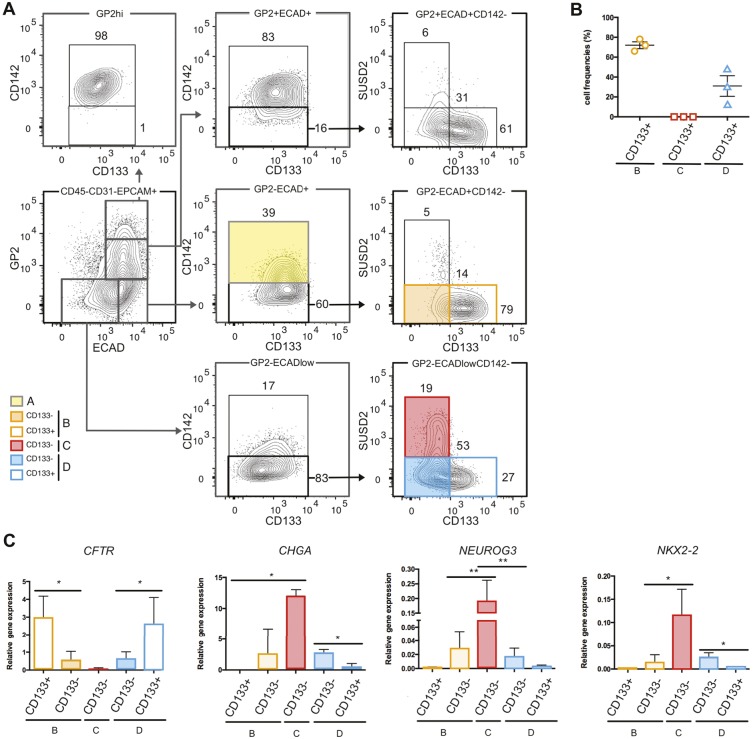
Fig. 3.
CD133 marks human fetal pancreatic ductal cells. (A) Flow cytometry analysis displaying the expression of CD133 in populations B, C and D at 11 WD. FACS plots are representative of three independent pancreata at 11 WD. (B) Cell frequencies of population B CD133+, population C CD133+ and population D CD133+ from three independent pancreata at 10 WD. (C) Expression of CFTR, CHGA, NEUROG3 and NKX2-2 (9-11 WD) by RT-qPCR in population B CD133+, population B CD133−, population C CD133−, population D CD133− and population D CD133+. *P<0.05, **P<0.001 (t-test; data are mean±s.e.m. of three independent pancreata).

