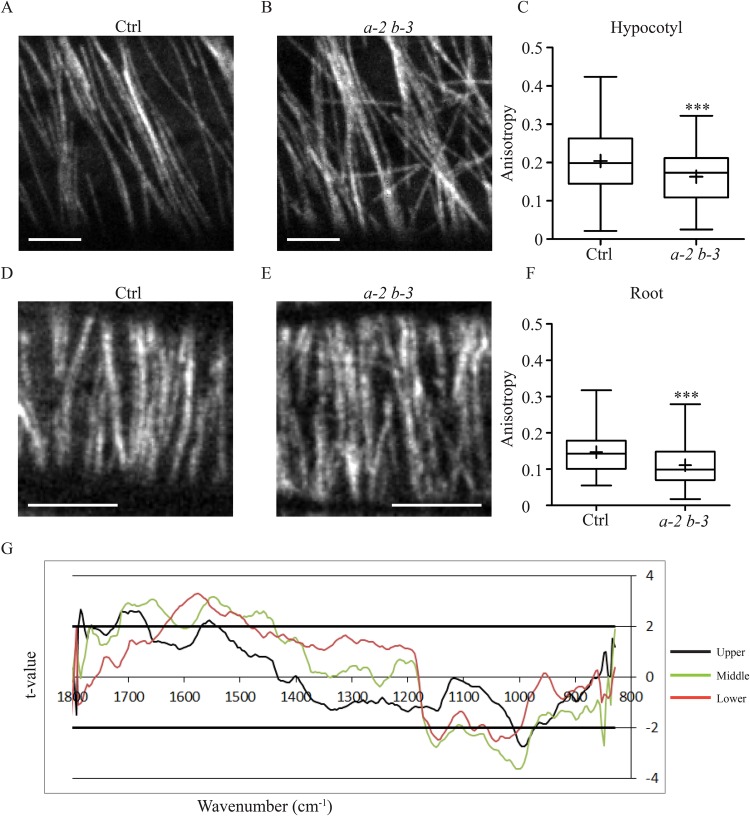
Fig. 1.
Microtubule network disorganization in eb1a-2 eb1b-3 double mutant. Representative pictures of GFP-tubulin-labeled MTs in elongating epidermal cells from etiolated-hypocotyl (A,B) and root (D,E). The elongation axis is horizontal. Scale bar: 5 µm. In the double mutant (B,E) the MT network is disorganized compared to the control (A,D) as shown by the quantification of MT network anisotropy (C,F) in etiolated-hypocotyl cells (C) and in root cells (F) for both control (n=109 and n=132) and eb1a-2 eb1b-3 (n=77 and n=112) genotypes. Crosses represent the mean, bars represent the median, and whiskers indicate minima and maxima. Asterisks indicate statistically significant differences (P=0.0009, t-test, in C and P<0.0001, t-test, in F) according to a Mann–Whitney U-test. (G) Student's t-test: t-value for the comparison between FT-IR spectra of control (Col0) and eb1a-2 eb1b-3 plant lines plotted against the wavenumber (x-axis). FT-IR spectra were obtained from the upper part (black line), the middle part (green line) and the lower part (red line) of growing hypocotyl of plants that do not express GFP-fused tubulin. Horizontal thick lines indicate the significance limit values (P=0.95).

