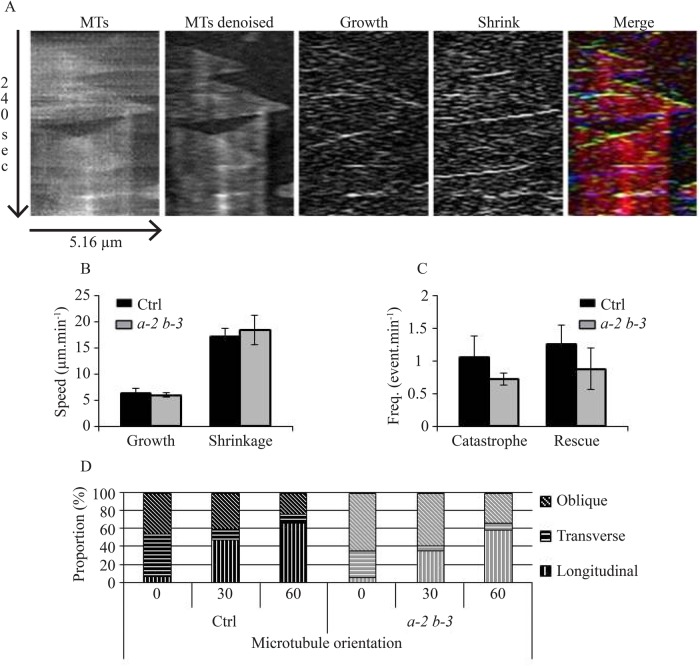
Fig. 3.
The microtubule dynamic instability is not affected in eb1a-2 eb1b-3 double mutant. (A) Kymographs showing the same MT before and after image treatment (first and second panels). Image subtraction reveals growth and shrinking events (third and fourth panels). Color encoding facilitates the interpretation of kymograph. Growth events, shrinkage events and entire MTs appear in green, blue and red respectively on the merged image (fifth panel). (B) Growth and shrinking rates of MT plus-end in control and eb1a-2 eb1b-3 double mutant. Bars indicate s.e.m. (C) Transition frequencies in control and eb1a-2 eb1b-3 double mutant. Bars indicate s.e.m. Rates and frequencies came from 158 MTs in control and 125 MTs in eb1a-2 eb1b-3. Averaged measurements from eight plants have been compared using a Mann–Whitney test with α=0.05 and, according to this test, differences are not significant. (D) Percentage of cells with transverse (70°-90°), longitudinal (0°-20°) or oblique (20°-70°) MT network organization during auxin treatment (10 μM) in control and double-mutant plants (both expressing GFP-tubulin) after 0, 30, and 60 min of treatment. Differences are not significant according to Chi-squared t-test.

