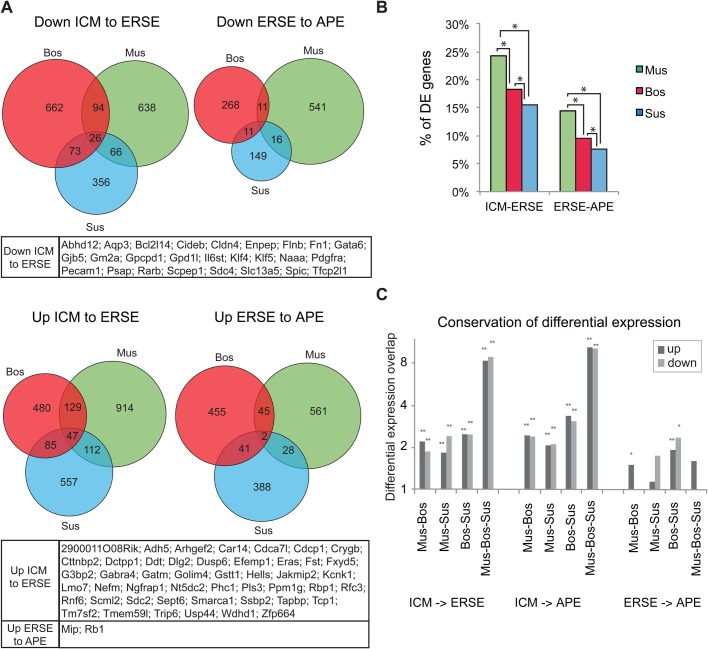
Fig. 4.
Differential expression analysis identifies common stage specific pluripotency-associated genes. (A) Venn diagrams showing the intersections of differentially expressed genes during epiblast development in the three species (with q-value ≤0.25, minimum fold change 1.5). Below each Venn is shown the list of genes belonging to the central territory of the diagram. (B) Graphs showing the proportion of differentially expressed (DE) 1:1:1 orthologues across stages. *P<10-17, χ2 test. (C) Graphs showing the conservation of differential expression between species. The conservation is expressed as the number of genes that are differentially expressed between stages in two or in three species, divided by the expected overlap if the same number of genes were independently sampled from the 1-1-1 orthologues in those genomes. P-values are based on the hypergeometric distribution, **P<1E -4, *P<0.01.

